Numeric Reporting: 8 Reports Your Accounting Team Needs

.png)
Where finance teams prove themselves to their organizations is in their ability to present data efficiently and surface accompanying insights. Not just in merely completing the close, and not even in producing accurate data.
Said differently, the ability of an accounting team to produce timely, relevant reports that execs care to read is what separates those value-creating teams from ones that do the bare minimum.
The #1 reason teams come to Numeric is to take advantage of the tool’s robust reporting capabilities. Josh Goldberg, Accounting Manager at Masterworks states that Numeric’s reporting is his favorite feature in the platform:
“It’s like having a real live dynamic pivot table with analysis that can be refreshed in real-time.”
Here’s a look at the types of reports teams actually leverage in Numeric today.
Why Reports Matter More Than Ever
Reports matter more than ever because all-star finance teams no longer simply “close the books”. Today, teams are expected to produce insights that can inform strategy, quantify tradeoffs, and highlight risk. The presence of good reporting is also a sign of good close maturity.
As such, great reporting is where A+ accounting teams shine and are recognized as strategic members of the company. Because of how difficult good report building can be, it’s a skillset that helps accountants progress in their careers and boosts companies’ growth potential.
And to add, building good reports is still often much easier said than done. Between lackluster and rigid ERP-native reporting tools, expensive BI tools that smaller companies may lack resources for, a dizzying array of Excel sheets, and the biggest culprit — poor data hygiene — finance teams struggle to get the slices of data that fuel business direction.
Reporting in Numeric
A lot of tools can work as checklists. But if you want to get beyond just close processes and actually into the most important month-end work – analysis – then better reporting and flux insights are the way.
Before Numeric, Michael Hoopes, an accountant at Parafin, would spend “quite literally 8 hours” building reports in NetSuite. Now, with Numeric, he can create the same reports in a fraction of the time.
More than any other feature, companies switch to Numeric to use the platform’s reporting tooling. With it, they can accomplish the following:
- Build diverse reports to support management, audit, legal, and financial inquiries and then save them for easy end-of-month retrieval
- Run agentic flux analysis on any individual account in their GL and any line item in their reports
- Pivot on any field and drill down into transactions from their GL to produce insights in minutes, rather than suffer trying to do the same thing in Excel
Numeric’s report builder gives teams the speed, flexibility and real-time numbers they need to find the answers they’re looking for.
Using Numeric’s AI Report Builder
CFO got a quick ask and wants to see a report on the fly? Simply don’t want to build reports completely from scratch? Trying to build a report, but not entirely sure where to begin?
Our Report Building Agent allows you to spin up reports with ease. Simply describe the outcome you want and an agent configures the report for you – adding filters, updating metrics, and restructuring report layout in real-time.
To test it out:
- Open the Reporting module
- Create a report with "Add Report" or select an existing one
- Hit "AI Assistant" in the top-right corner and begin prompting
- If you want to see the agent in action, open the Editor in the top-right corner and watch it modify the report as you chat.
- After each response, the AI agent will give you the option to Keep or Undo your changes, so you're always in control.
Curious about what to ask? Try prompts like “How should I group my income statement?” or "What reports should I build for a board meeting?" and let the AI guide you.
How Build a Report in Numeric
The report builder in Numeric is designed for flexibility, allowing finance teams to create both one-off analyses and recurring Flux reports directly integrated with their NetSuite data.
The initial set-up is fairly simple:
- Teams can add basic details about what timeframes to preview, select the statement type (Income Statement of Balance Sheet), and then state if the report should be for individual subsidiaries or consolidated.
- From there, one can select which prior periods to include for comparison and if they’d like to include variance columns.
Where Numeric’s report builder shines is in its ability to offer granular control over your financial data. With filters, grouping, and metric rows, teams can generate finely tuned reports across their data.
- Filters: Apply report-wide filters based on ERP attributes like Department, Class, Location, or specific Accounts. For efficiency, you can create "Saved Filters" (e.g., "G&A OPEX") to apply standard logic across multiple reports.
- Grouping: You can organize accounts into custom groups using Static conditions (manual selection) or Dynamic conditions (rules-based).
- Dynamic Grouping: This is highly recommended for scalability. By setting a rule (e.g., "Account Code starts with 4"), new accounts added to NetSuite that match this criteria will automatically appear in the report without manual updates.
- Metric Rows: Create calculated rows to derive specific KPIs, such as a "Profit" row created by subtracting an Expense group from a Revenue group.
As a final note, any new report is Ad-Hoc. You can set new reports to recur, and once you do, they become part of the Flux Analysis module, allowing you to leverage AI-generated explanations, add manual notes, and assign review tasks.
Numeric: the #1 tool for continuous closes
.png)
8 Reports Your Team Can Build Today
Below are eight of the most common reports accounting teams build in Numeric, organized by use case. Each includes the reporting logic needed to build it and the business context for when to use it.
💼 Management & FP&A Reporting
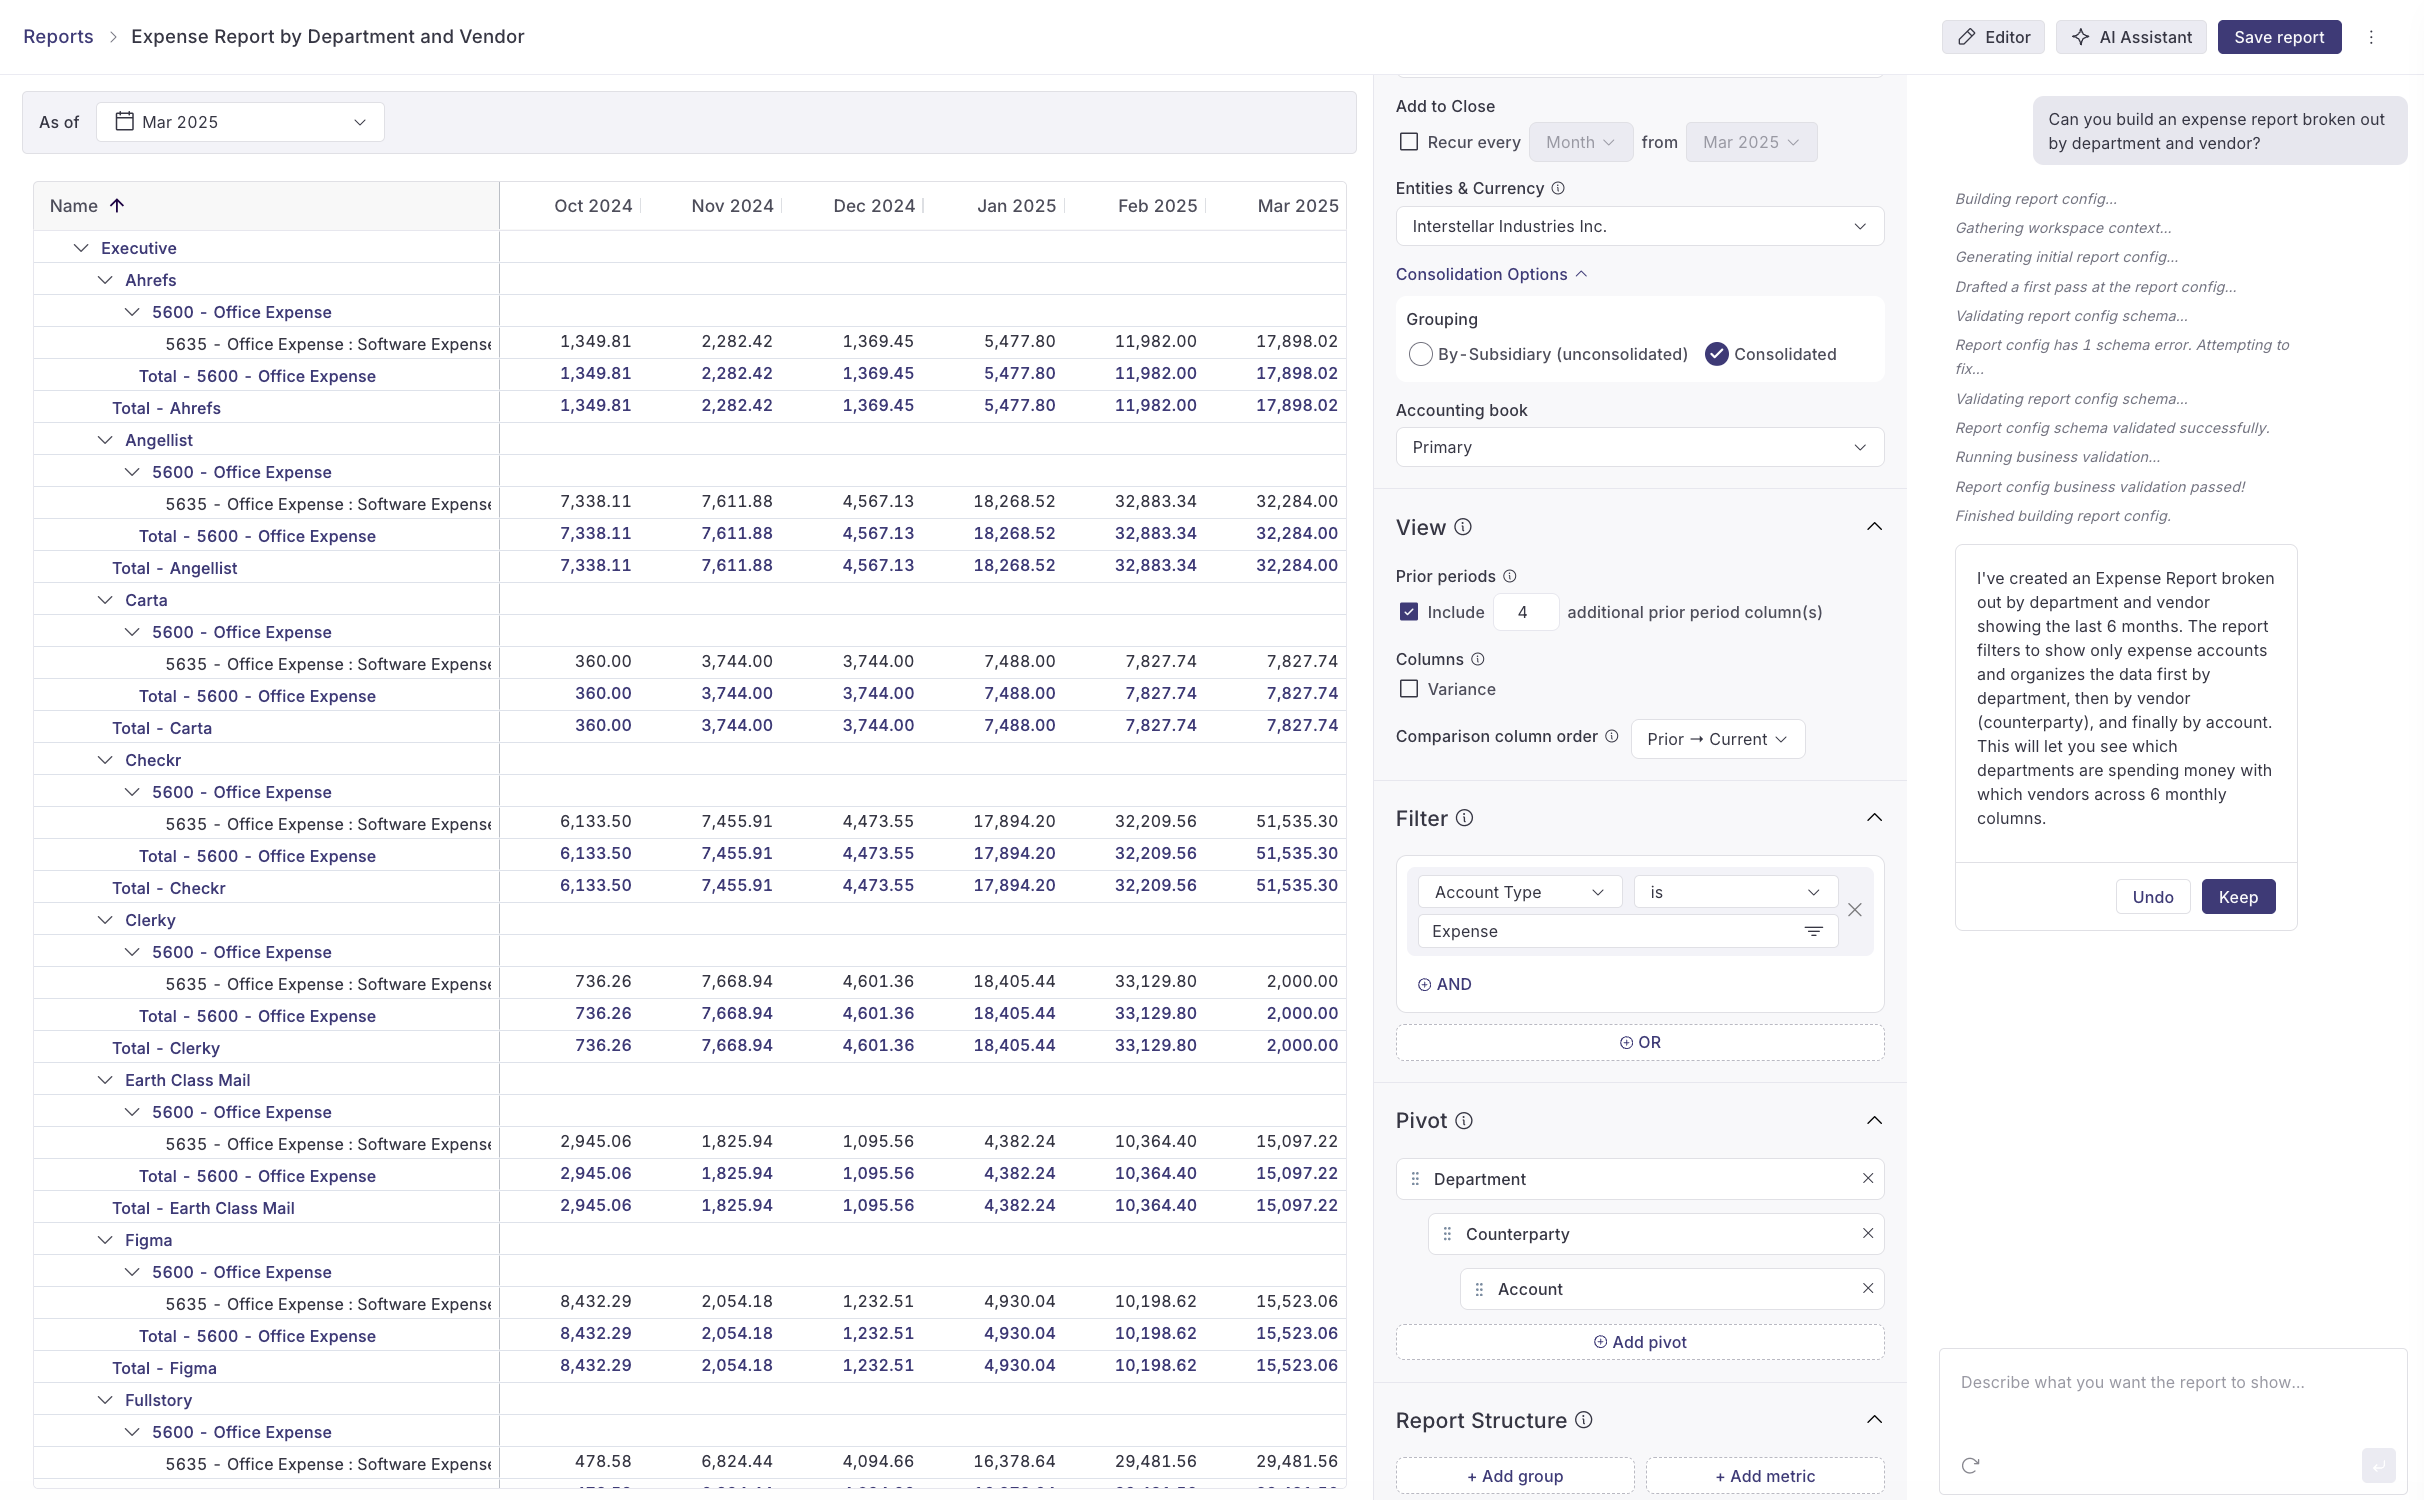
Expense by Department + Vendor
How It Works:
This report groups all expense transactions first by department (e.g., G&A, R&D, S&M), then breaks down spend within each department by vendor.
How to Build:
- Filter to expense accounts only (OPEX + COGS account types)
- Pivot by Department first, then add Vendor as a secondary pivot
- Configure for your desired comparison period (typically MoM or QoQ)
- Optional: Add variance columns to track changes period-over-period
Why It’s Useful:
This report is essential for understanding departmental burn rates and vendor concentration.
Finance teams use it to answer questions like "How much is R&D spending on AWS?" or "Which vendors are we using across multiple departments?" It's particularly valuable during budget reviews, vendor negotiations, and when leadership asks "Where is our money going?"
The team at STASH finds this report useful for tracking important expenses such as their spend on AWS, etc.
Adjusted EBITDA
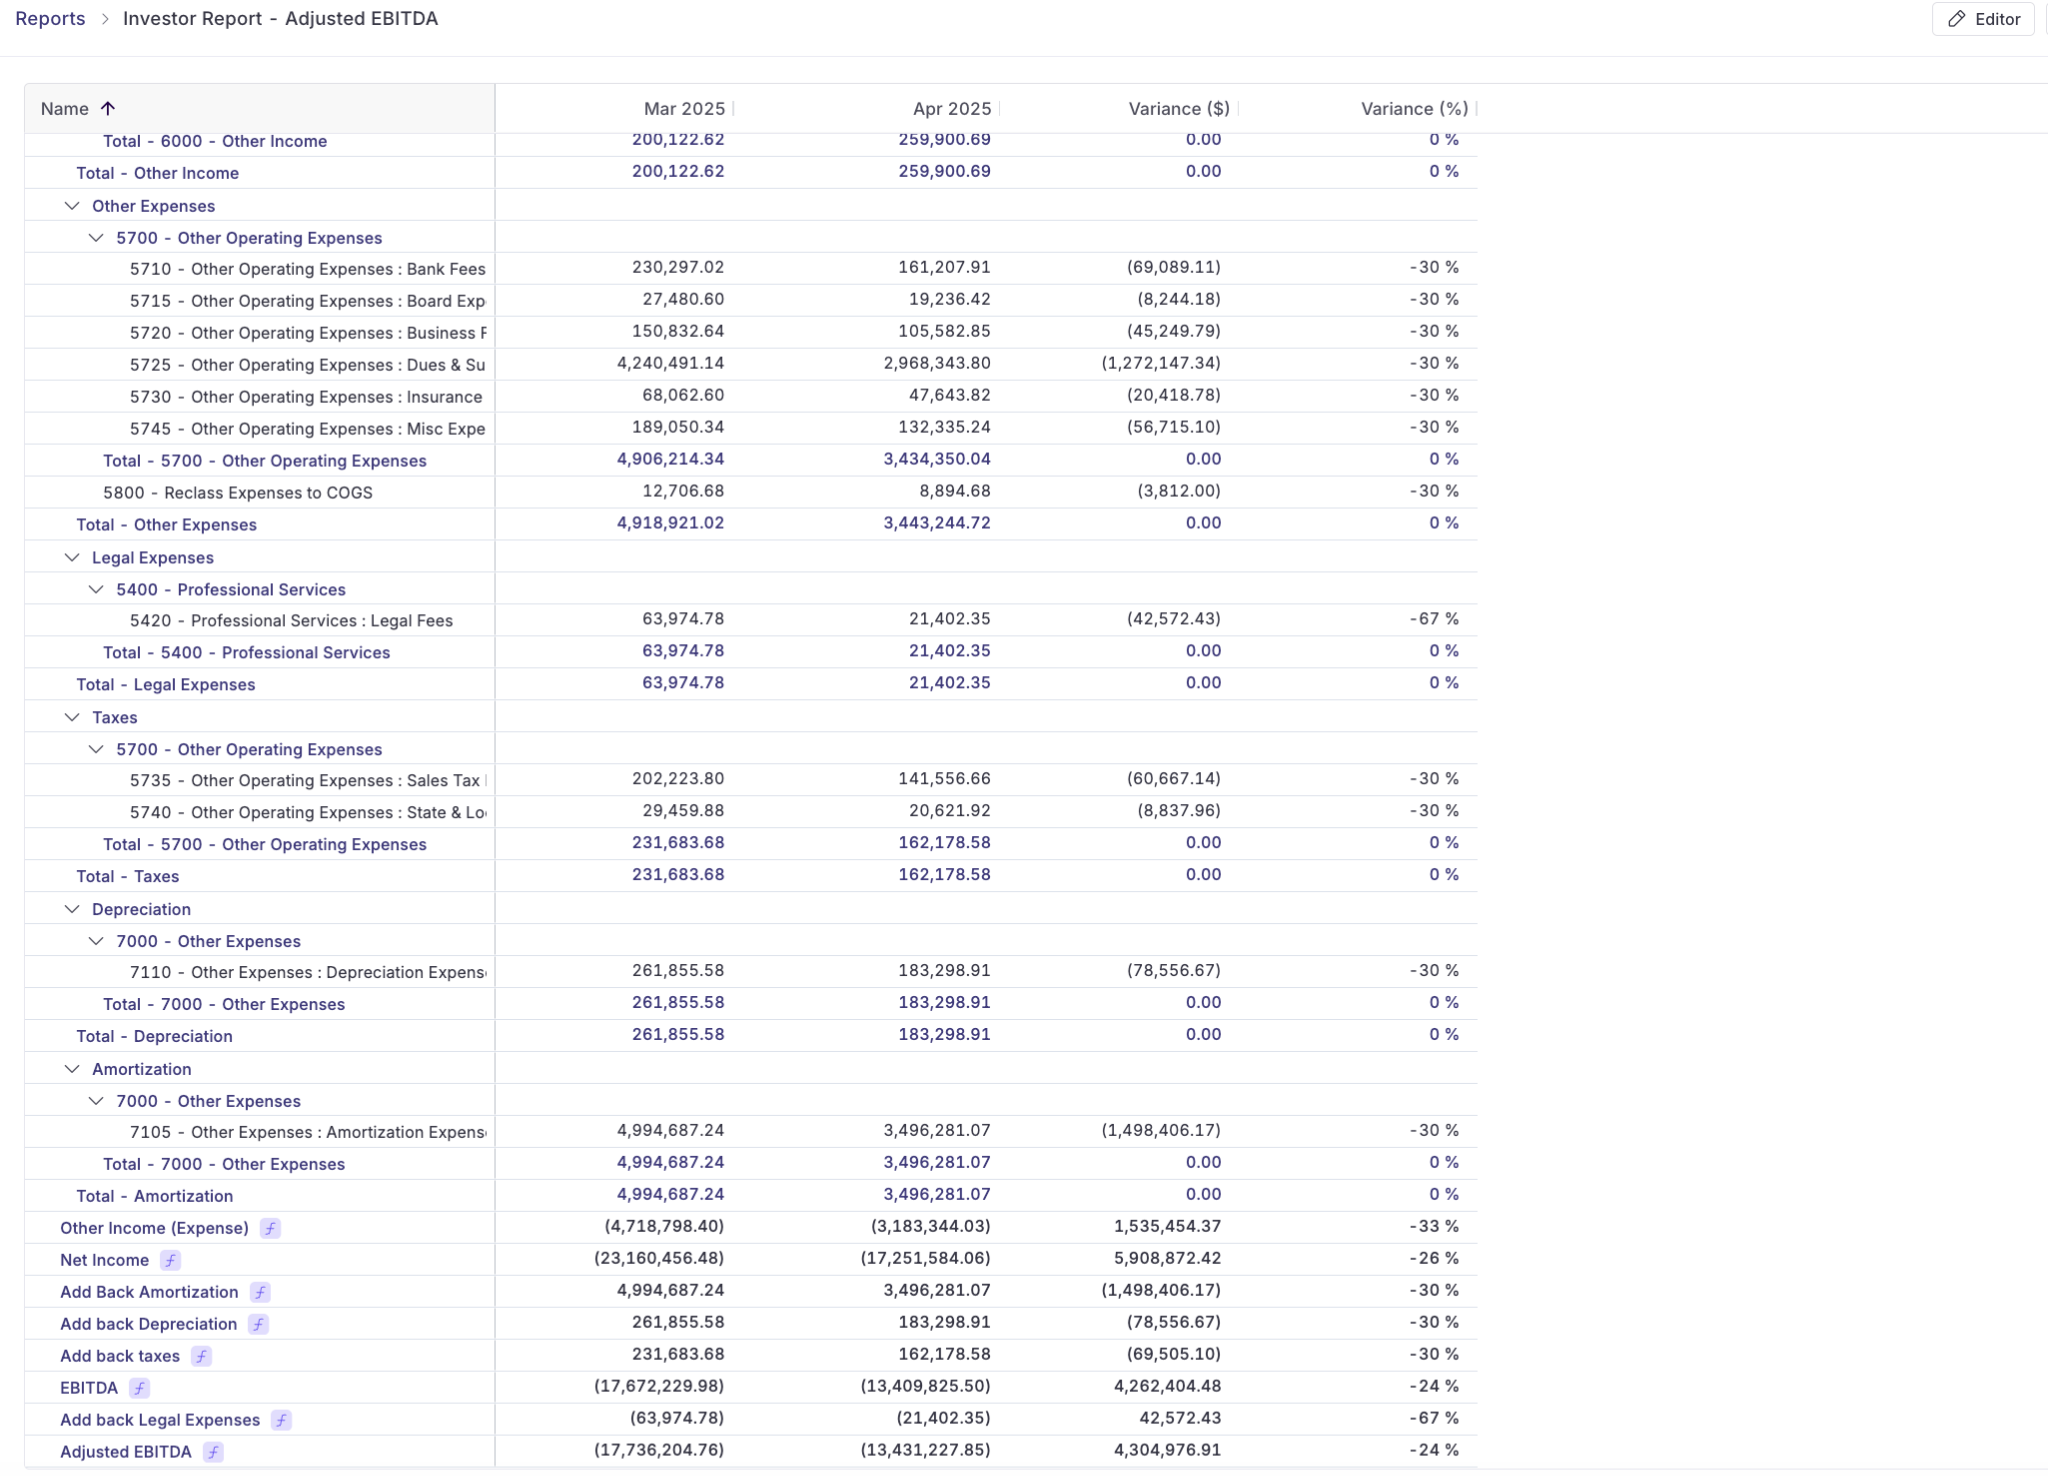
How It Works:
This report builds a bridge from Net Income to EBITDA to Adjusted EBITDA by creating calculated metric rows that add back non-operating expenses. The report structure shows your standard income statement flowing to Net Income, then systematically adds back interest, taxes, depreciation, and amortization to arrive at EBITDA. From there, you add back one-time or non-recurring expenses (like legal fees, restructuring costs, or stock-based compensation) to calculate Adjusted EBITDA.
How to Build:
- Start with your standard I/S structure flowing through to Net Income
- Create metric rows to add back D&A, taxes, and interest to calculate EBITDA
- Create groups for adjustment categories (Legal Expenses, One-time Costs, Stock Comp, etc.)
- Build final metric row for Adjusted EBITDA that sums EBITDA + all adjustments
- Configure comparison periods to show the bridge calculation across time
Why It's Useful:
Adjusted EBITDA is the metric investors and boards use to evaluate operating performance by stripping out non-cash expenses and one-time costs. This report is critical for board presentations, investor updates, and debt covenant compliance where lenders often tie requirements to Adjusted EBITDA thresholds.
The beauty of building this in Numeric is the flexibility of custom groupings and in-report reconciliation - you can clearly show the walk from Net Income through each adjustment layer. Instead of maintaining complex Excel reconciliations that break when your chart of accounts changes, this report automatically recalculates as transactions flow through.
Income Statement with Functional Expense Disaggregation
How It Works:
This report displays your standard income statement structure (Revenue → COGS → Gross Profit → OPEX → Net Income) but breaks out operating expenses by functional expenses like G&A, R&D, and S&M. Some teams include a "No Department" line item that flags any transactions missing department coding.
Note: If you set up this structure and see “No Department” appear in a report even once, then create a Monitor that flags the relevant data issue. Doing so will ensure you catch data issues before they appear in a report.
How to Build:
- Start with your standard income statement account structure
- Add department as a grouping specifically for the OPEX section
- Configure your department groupings to match your reporting structure (typically G&A, R&D, S&M)
- Add a condition to capture and display transactions where department is empty
- Set formatting to show both current period and prior period columns for variance analysis
Why It’s Useful:
Leadership and board members expect to see expenses broken out by functional area to understand the cost structure of the business - how much you're investing in product development versus sales versus keeping the lights on.
The "No Department" check serves as a data quality control, ensuring you catch miscoded transactions before they distort departmental metrics. This report is typically used in monthly board decks, budget vs. actual reviews, and when calculating unit economics like CAC or LTV where you need clean departmental expense allocation.
Income Statement with Natural Expense Disaggregation
How It Works:
This report displays your income statement with operating expenses broken out by natural expense classification - the type of expense (salaries and wages, rent, software, professional fees, insurance, depreciation, etc.) rather than functional areas. Unlike functional expenses which are typically tagged at the transaction level in fields like "Department," natural expenses require grouping entire GL accounts or specific slices of accounts based on what the expense actually represents.
How to Build:
- Start with your standard income statement account structure
- Create custom groups for each natural expense category (Compensation & Benefits, Occupancy Costs, Professional Services, Software & Technology, etc.)
- Use dynamic filters within each group to capture relevant GL accounts - for example, the Compensation group might include accounts 6000-6999, or use "Account Name contains 'Salary'" logic
- Apply additional filters if needed to slice accounts by Class, Department, or other dimensions when a single GL contains mixed natural expense types
- Reorder groups to present natural expenses in a logical flow for your audience
Why It’s Useful:
Natural expense classification is increasingly required for financial statement disclosures, and is becoming more common in investor reporting where stakeholders want to understand the composition of expenses rather than just departmental allocation.
The challenge with natural expenses is that they don't map cleanly to standard ERP fields - your "Salaries" might span 20 different GL accounts across multiple departments.
Numeric's grouping capabilities let you define the logic once (using dynamic rules like account code ranges or account name patterns) and the report automatically includes new accounts that match your criteria. This eliminates the monthly Excel gymnastics of manually categorizing accounts and ensures your natural expense disclosures stay accurate as your chart of accounts evolves.
For companies that need both functional AND natural expense views, you can build complementary reports - one showing the traditional departmental breakout, another showing natural classification.
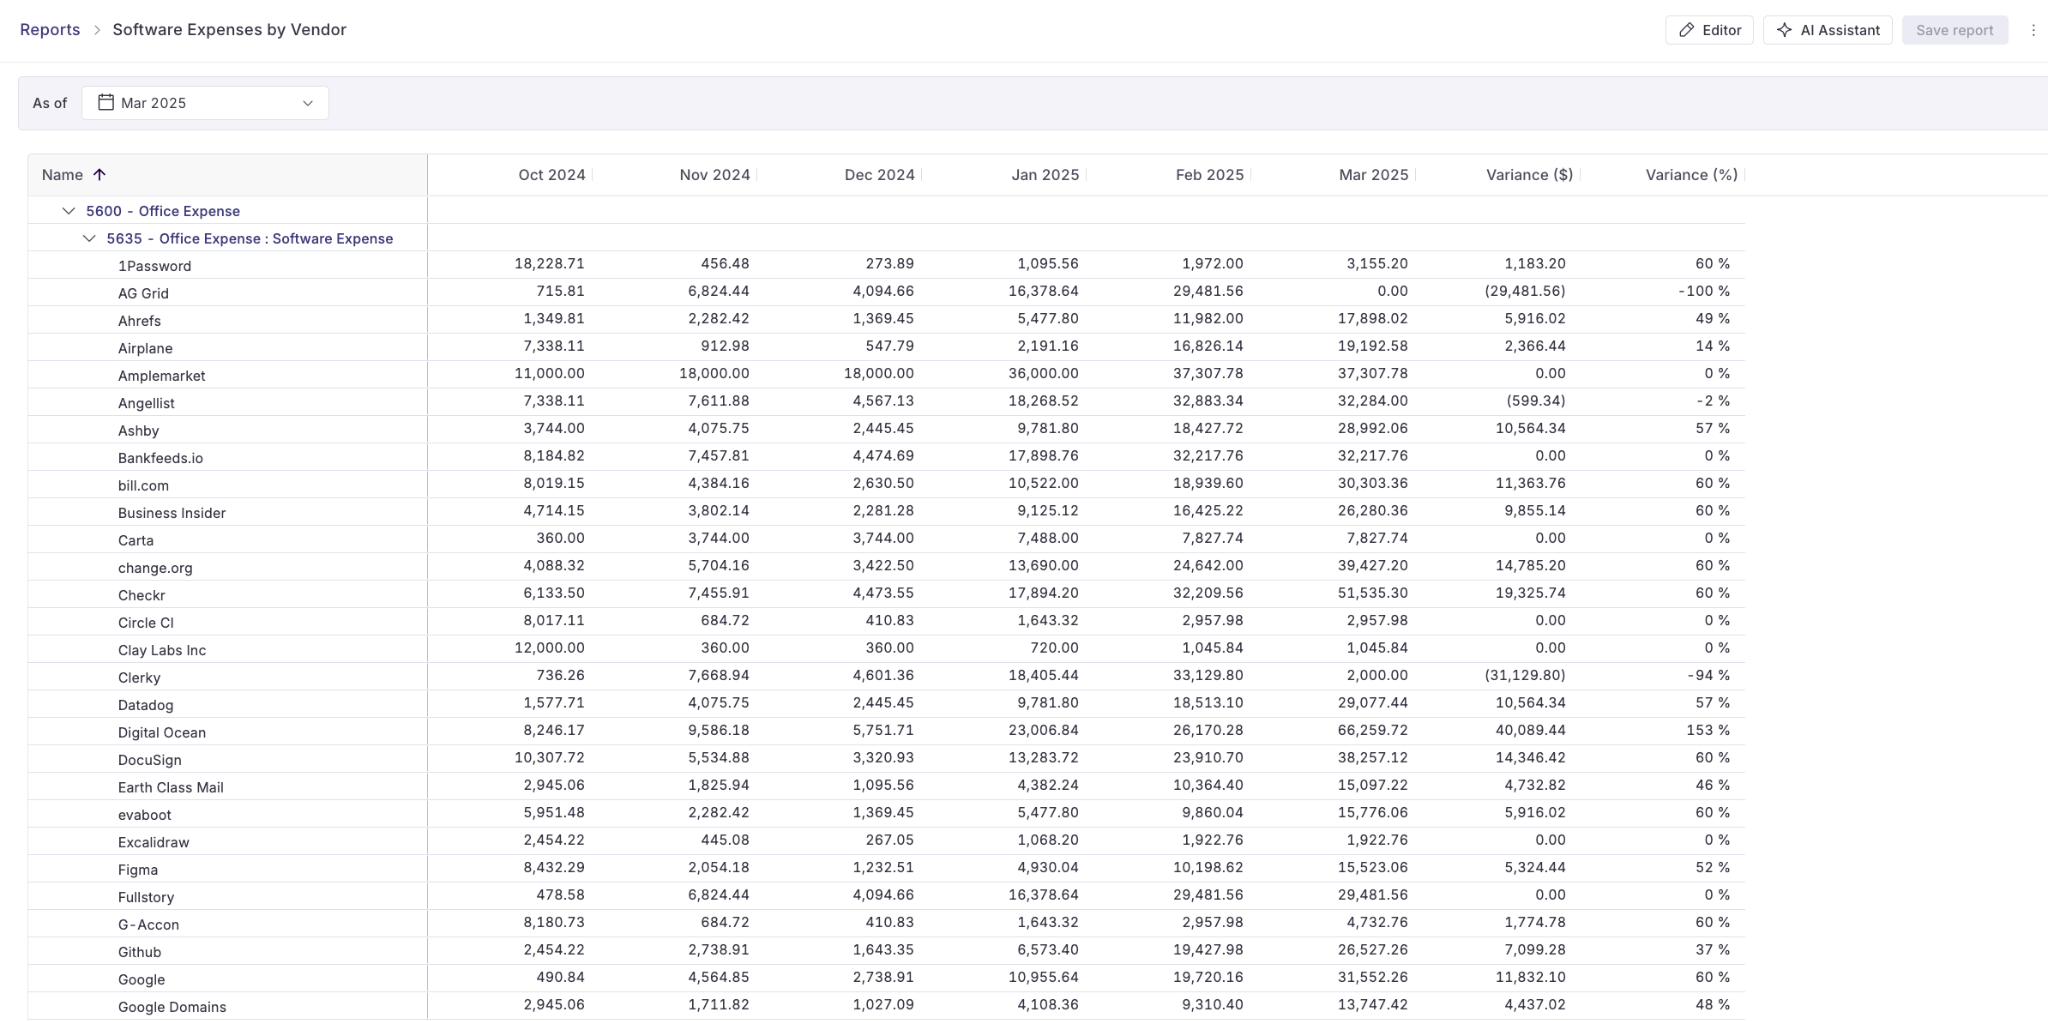
OPEX by GL Account + Vendor
How It Works:
This report drills into operating expenses at the most granular level, showing each expense account (e.g., Software - SaaS, Travel, Professional Services) and then breaking down every vendor within that account. It's essentially a detailed spend analysis that answers "who are we paying for what?"
How to Build:
- Filter to OPEX account types only (exclude COGS and revenue)
- Pivot by Account first to see each expense GL account
- Add Vendor as a secondary pivot to show vendor breakdown within each account
- Configure date range for the analysis period
- Optional: Add variance columns to identify month-over-month or year-over-year spending changes
Why It's Useful:
Controllers use this report for deep vendor spend analysis, particularly during procurement reviews, contract renewals, or when trying to identify cost savings opportunities.
If you're evaluating whether you're overpaying for software, have vendor sprawl, or need to consolidate contracts, this report surfaces those insights. It's also valuable during audits when you need to explain specific vendor relationships or during budget planning when you're forecasting category-level expenses.
📋 Balance Sheet Reporting
Detailed Grouped Balance Sheet
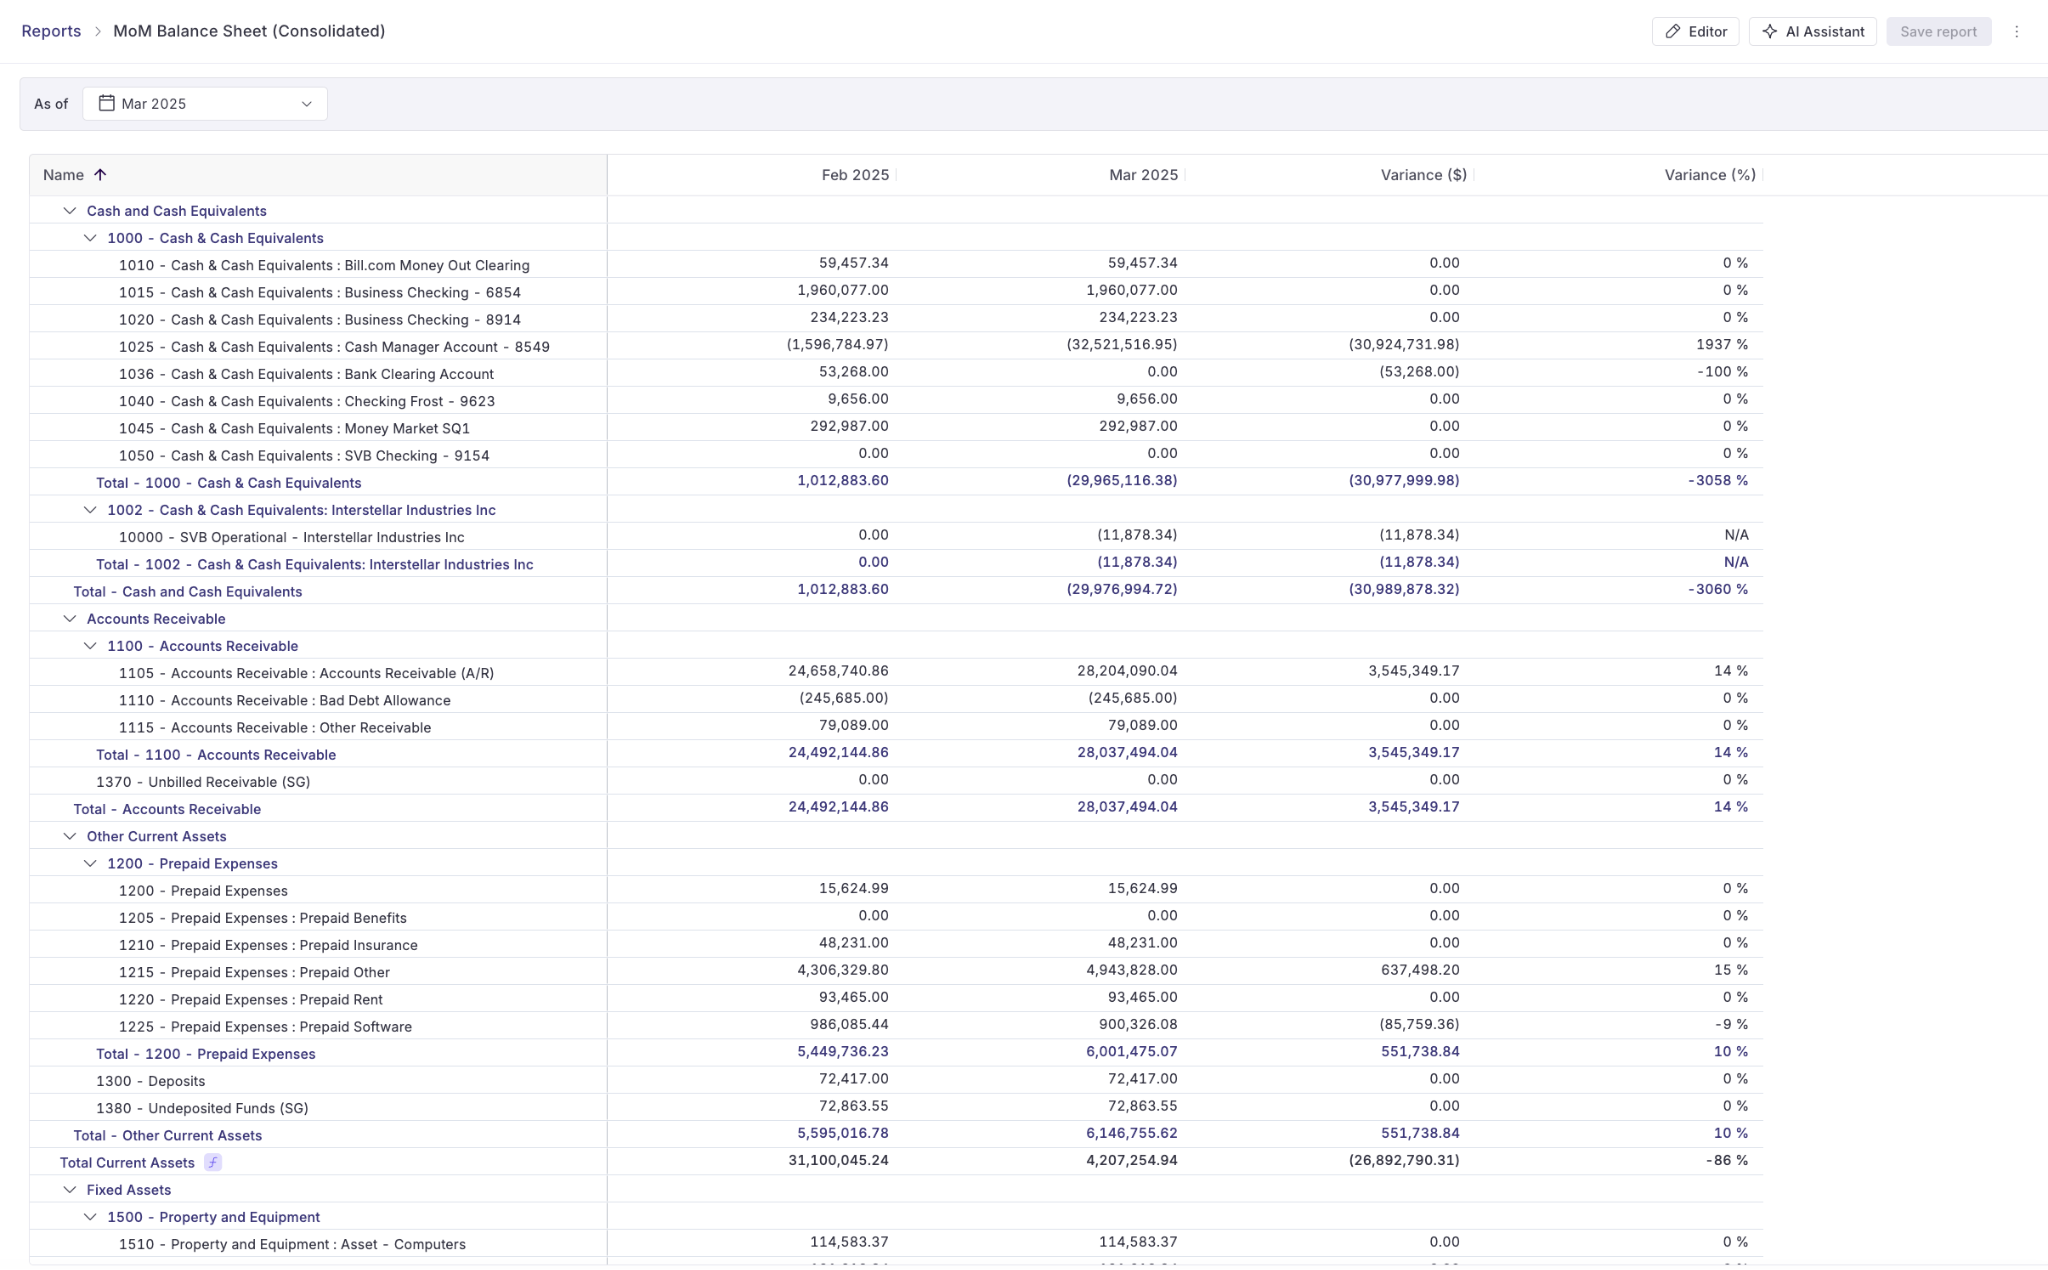
How It Works:
This report takes your chart of accounts and organizes balance sheet line items into custom groupings that go beyond the standard asset/liability/equity structure. You might group multiple prepaid accounts under "Prepaid Expenses," consolidate various accrual accounts into "Accrued Liabilities," or create specific groupings for different liability types (current vs. non-current, operating vs. financing leases, etc.).
How to Build:
- Start with all balance sheet account types (Assets, Liabilities, Equity)
- Create custom groupings that match your financial statement presentation
- Organize accounts into meaningful categories (e.g., "Current Assets" → Cash & Cash Equivalents, Accounts Receivable, Prepaid Expenses)
- Set up the standard balance sheet equation flow: Assets → Liabilities → Equity
- Add prior period columns for balance change analysis
Why It's Useful:
Standard balance sheets in NetSuite often show too much detail (every single GL account) or not enough structure (minimal groupings). This report lets you present the balance sheet exactly how your board, investors, or auditors expect to see it.
It's particularly valuable for companies with complex balance sheets - multiple entities, various prepaid/accrual accounts, or detailed fixed asset tracking. You can create the clean, professional balance sheet that goes in your board deck while maintaining the ability to drill into the underlying detail when needed. This is also the foundation for creating balance sheet footnotes and disclosures.
Mapped Disclosures for Footnotes
How It Works:
This report groups specific balance sheet accounts into disclosure categories required for financial statement footnotes. For example, you might map several different accrual accounts (accrued payroll, accrued bonuses, accrued vacation, accrued taxes) into a single "Accrued Liabilities" disclosure line. The report shows both the individual accounts and their rolled-up disclosure presentation.
How to Build:
- Identify which accounts need to be disclosed together in your financial statement footnotes
- Create groupings that match your footnote disclosure requirements (e.g., "Property & Equipment, net" might include multiple fixed asset accounts and accumulated depreciation)
- Filter to the specific balance sheet sections relevant for footnotes
- Configure to show both the detail (individual accounts) and summary (disclosure grouping)
- Set as period-end report (typically month-end or quarter-end for audit purposes)
Why It's Useful:
Auditors and investors require specific disclosures about balance sheet composition - you can't just show "Accrued Liabilities" as one number, you need to break down what's in there. This report creates the bridge between your detailed GL and your disclosure requirements.
During audit season, this saves hours of manually pulling account details and grouping them into footnote schedules. It's also critical for companies preparing for IPO or raising capital, where financial statement footnotes need to follow GAAP presentation standards. Instead of rebuilding these disclosures every quarter in Excel, you have a repeatable report that automatically pulls the right accounts into the right disclosure categories.
Classified Balance Sheet Views for Investor or Board Reporting
How It Works:
This report presents your balance sheet with strategic reclassifications that differ from your statutory books. You might reclassify certain assets or liabilities to better align with how investors or your board thinks about the business, combine immaterial line items, or restructure the presentation to highlight key metrics like working capital or net debt.
How to Build:
- Start with your standard balance sheet structure
- Create custom groupings that reflect investor/board preferences (e.g., "Cash & Marketable Securities" combining multiple accounts, "Net Working Capital" showing current assets minus current liabilities)
- Apply reclassifications - for example, moving debt issuance costs, reclassifying certain assets from non-current to current, or netting related accounts
- Create metric rows for calculated values (Total Debt, Net Cash Position, Current Ratio components)
- Format to emphasize key metrics your audience cares about
Why It's Useful:
Your GAAP balance sheet and your investor-friendly balance sheet often aren't the same thing. Investors care about cash position, total debt, and working capital trends - they don't need to see every individual prepaid account.
This report lets you maintain GAAP compliance in your books while presenting a cleaner, more strategic view to external stakeholders. It's particularly valuable for board presentations where you want to focus the conversation on high-level financial health rather than accounting minutiae.
You can also use this to create "management balance sheets" that align with how your CFO talks about the business, even if the underlying books follow standard accounting categories.
Conclusion
The accounting teams at Masterworks, STASH, and Parafin have built comprehensive reporting frameworks in Numeric that rival standalone BI tools—complete with custom dimensions, dynamic groupings, and automated variance analysis.
The difference?
Their reports stay connected to the source data, update in real-time, and live alongside the rest of their close process. No more bouncing between NetSuite, Excel, and three other tools to answer a single question. These days, just one tool – Numeric – does the trick.
Related Content
.png)
Numeric vs. Ledge: What's the Best Close Platform for Your Business?
A detailed comparison of Numeric and Ledge, two modern close management platforms, covering features, architecture, pricing, and a framework for choosing the right fit for your team.
.png)
What is Record to Report: Process, Steps, and Benefits
Learn how the Record to Report process works, from transaction capture to financial reporting. Discover steps, challenges, automation strategies, and best practices for modern accounting teams.
.png)
Cash Runway In 2026: Formula, Analysis, And How To Extend It
Learn what cash runway is, how to calculate it correctly, how to analyze and extend it, and why reconciled cash data is the foundation of a trustworthy runway number.