Cash Position For Finance Teams: A Complete Guide To Liquidity, Daily Workflows, And Tools

.png)
it’s perfectly normal for leadership to ask the finance team, “What is our cash position right now?”
It’s also perfectly normal for the finance team not to have a real-time, comprehensive number that they can offer with 100% certainty. The reality is that calculating a cash position requires pulling data from multiple sources, like bank accounts, investment accounts, credit cards, and payment processors. Because the cash itself is distributed across these accounts, without accessing and exporting the account data, accountants can’t produce a reliable figure for the organization’s cash position.
And, even once the data is available, timing and reconciliation issues can cause further detours on the path to a clear answer.
This article will cover how organizations can remedy the challenges posed in presenting a clear cash position. Thanks to modern tools and integrations, it’s more feasible than ever to transition from backward-looking manual reports to automated, near real-time account visibility. Clearer answers, higher confidence, and much faster results await.
Key Takeaways:
- “What’s our cash position?” isn’t an easy question to answer. Data sits scattered across banks, processors, and cards, which take time and effort to reconcile.
- Cash position drives major operational decisions. Without real-time visibility, leadership is flying blind.
- The same $100K cash balance can tell two completely different stories. Pair it with positive cash flow and you're growing profitably; pair it with burn and you're four months from insolvency.
- Small improvements to your cash conversion cycle can create outsized liquidity gains.
- Spreadsheet-based cash tracking breaks down at scale. Modern tools with AI-powered matching and automated cash reconciliation free finance teams to focus on strategy instead of manual workflows.
What Cash Position Actually Represents
So, what is “cash position?”
Cash position is the amount of cash and cash equivalents (liquid, short-term investments that can be converted to cash in under 90 days) available to an organization at a specific point in time. It represents the liquidity that your organization has available to meet obligations. The 90-day maturity requirement ensures that only reasonably liquid investments are counted.
At a more granular level, Controllers also look at gross cash and net available liquidity:
Gross cash is the total amount of cash and cash equivalents that an organization has across all accounts. This is the figure before factoring in any restrictions, commitments, or debts.
Net available liquidity is the amount of cash available after accounting for constraints. This figure can include restricted or legally segregated cash, cash that’s pledged as collateral, minimum balances in accounts, and other commitments that limit how much of the organization’s gross cash is actually available.
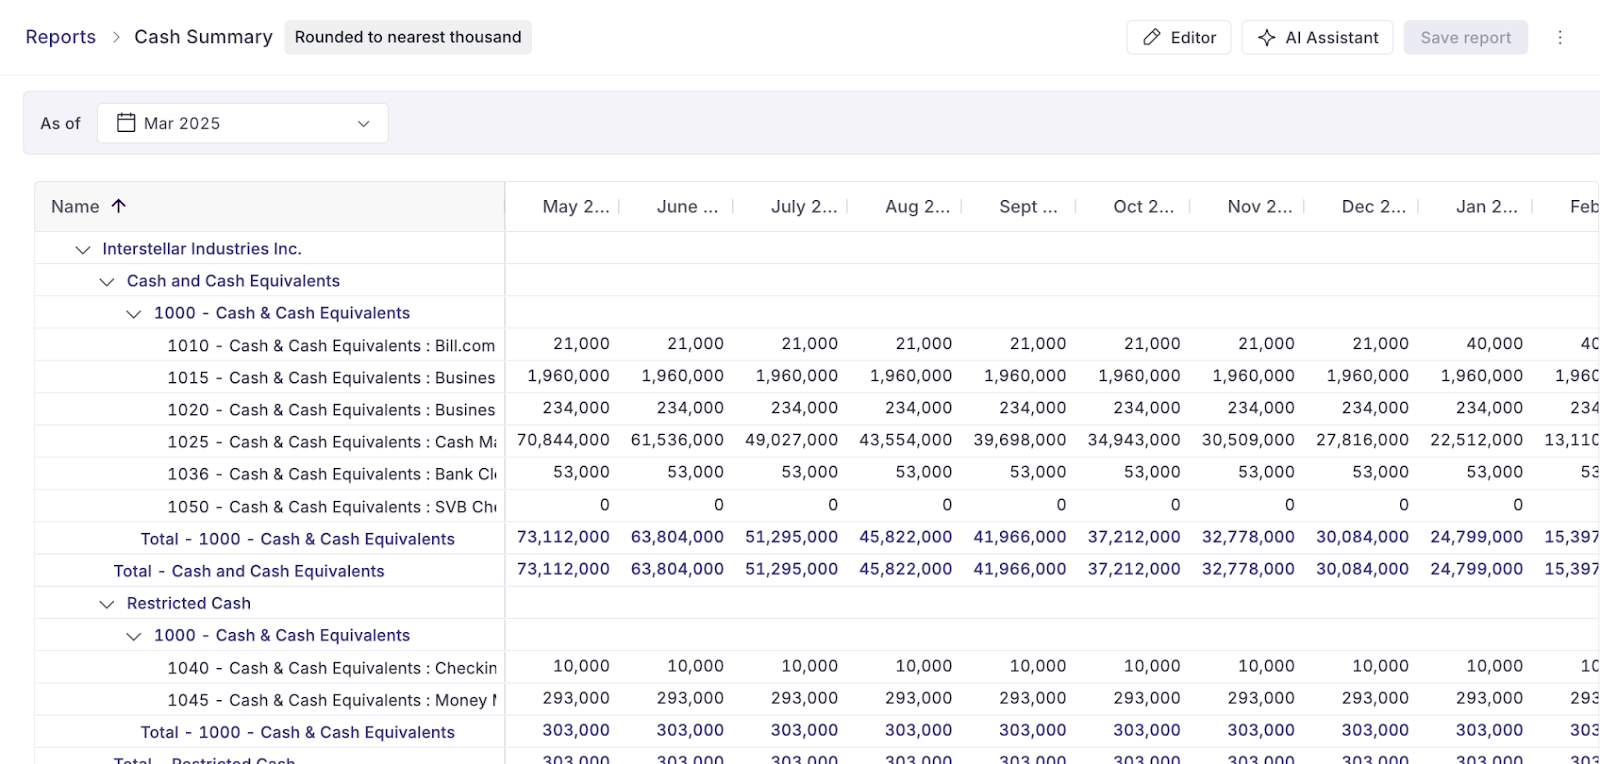
While reporting often captures period-end cash and cash equivalents, it’s best practice to also have daily or intraday visibility into your cash position. For decision-making agility and risk assessment, the difference between a month-end cash position calculation and a real-time, intraday snapshot can be significant. On Numeric, teams can rely on dashboarding in the Cash Management module to stay up-to-date on their cash position and daily cash reconciliation status.
Cash Position Versus Cash Flow, Working Capital, And Profit
One helpful mental model is to envision cash position as a photograph. It captures your liquidity at a specific moment in time. Cash flow, meanwhile, is like a video that over time shows how liquidity flows in and out of your accounts. Cash flow forecasting extends that video into the future, helping teams anticipate what their liquidity will look like weeks or months ahead.
This distinction is meaningful because cash position tells one side of your organization’s story, and cash flow can change that story completely.
For instance, a small company with $100,000 of cash may be in imminent financial trouble if their monthly expenses are $75,000 and monthly sales are only $50,000. In 4 months, they’ll be out of cash.
By contrast, a company with $100,000 of cash might have $50,000 monthly expenses, $80,000 in monthly sales, and $100,000 in unpaid invoices that will be paid over the next 30 days. They’re cash flow positive and profit about $30,000 per month.
The same cash position tells two diverging stories once paired with cash flow. Note that in the second example, the company’s cash acts as a significant buffer; it can also be the case, however, that profitable companies maintain dangerously weak cash positions.
Another granular way to assess an organization’s cash is working capital. It’s calculated as current assets minus current liabilities, or what you have versus what you owe (usually within one year). Positive working capital means that you have enough liquidity to cover short-term costs and continue operations.
In a nutshell:
- Cash position: “Can we pay today?”
- Cash flow: “Are we making or losing money?”
- Working capital: “Can we keep the lights on?”
For Controllers and CFOs, the difference in the scopes and purposes of these measurements only illustrates the importance of having real-time or near real-time visibility into each.
Why Controllers And CFOs Care About Cash Position
An organization’s cash position factors heavily into decision-making. Liquidity is key for keeping the organization running, and without knowing how much exists and where, it’s difficult for leadership to make decisions with any speed or confidence.
Cash position affects an organization’s ability to operate across several critical areas:
- Making payroll: Cash position determines whether there's enough cash to pay employees on schedule. Missing payroll jeopardizes morale and could violate labor laws.
- Timing vendor payments: Knowing your cash position can help you decide whether to pay vendors early (for example, to capture discounts) or, if cash is tight, to negotiate extended terms.
- Drawing or repaying debt: Depending on cash position, you may need to tap a credit line to cover shortfalls. Or, a cash surplus can be used to pay down debt and reduce interest costs.
- Approving CapEx: Before committing to equipment purchases, facility improvements, or other capital expenditures, you need to confirm there's sufficient cash to make payments without affecting other operations.
- Negotiating terms with banks and investors: A strong cash position gives you leverage to negotiate better loan rates, credit terms, or investment deals. A weak position limits your options and bargaining power.
And, it’s not only your cash position that lenders or other stakeholders scrutinize when negotiating terms. Maintaining a consistent, well-defended cash position (and reporting that position accurately) is key to demonstrating the credibility of your organization.
To make the most of your cash position reporting, consider the organizational benefits that your accounting team could deliver with the aid of closer integrations and real-time visibility. As AI and automation become more embedded into the modern financial software stack, accountants are playing an increasingly strategic role, advising decision-makers and acting as partners to department heads and team leads. Instead of simply reporting cash position, the modern accountant helps other members across the organization understand the cash position and how it impacts their efforts.
The #1 Cash Management Tool for Accounting Teams
.png)
Core Formulas And KPIs For Measuring Cash Position Health
Even with accurate numbers in hand, there’s a gap between raw cash balances and actionable insights.
That’s why accountants use a variety of formulas, ratios, and KPIs to expand on the basic cash position and provide more contextualized reports. These additional calculations elevate the cash position from a simple liquidity snapshot into a pivotal data point for understanding your organization’s financial health.
Basic Cash Position And Cash Position Ratio
At a basic level, this is how cash position is calculated:
Cash position = cash + cash equivalents + same-day liquid investments
(Optionally, short term debt that must be serviced immediately is then subtracted.)
The cash position ratio builds on this foundation by measuring the cash position against the organization’s current liabilities:
Cash position ratio = current liabilities / cash position
This ratio reveals how much of your organization’s short-term financial obligations could be covered with the cash you currently have. It’s useful for stress-testing liquidity independently of revenue, and for assessing risks in case of adverse scenarios (e.g., revenue disruption, delayed collections, market shocks).
In your calculations, you may elect to use a tighter cash position ratio. This means only including true cash and cash equivalents, while excluding restricted or encumbered cash. A tighter ratio results in a more realistic (but potentially lower) final figure. A conservative ratio, meanwhile, assumes worst case conditions. By excluding cash that may be technically available but operationally risky to use, or calculating obligations as if they must be met immediately, a conservative cash position ratio reveals your organization’s true level of financial risk if the worst comes to pass.
Note that a tight ratio isn’t necessarily conservative, and a conservative ratio isn’t necessarily tight.
But no matter which ratio you use, the important lesson is that cash and obligations are multidimensional. By failing to segment cash by restricted versus unrestricted, or not tracking the entity or currency that a cash account corresponds to, you risk calculating a cash position ratio that overestimates your usable liquidity.
Days Cash On Hand And Runway
While the cash position ratio takes a bird’s-eye view of your organization’s liquidity and obligations, days cash on hand is a clear, direct evaluation of how many days your organization can keep operating if no more cash comes in house:
Days cash on hand = cash position / average daily cash operating expenses
In other words, cash days on hand tells you how long your current cash will last if expenses continue at the same rate.
Cash days on hand is an important metric, and even more so for high-growth or venture-backed companies that calculate runway based on burn. In their early stages, these businesses often burn more cash than they earn, and their cash position therefore deteriorates. Days cash on hand tells stakeholders the gravity of that deterioration, which is key to financing and hiring plans.
It’s also common to set target ranges for days cash on hand. Depending on your organization’s business model and the volatility involved, these ranges can guide defensive actions or risk management decisions.
Cash Conversion Cycle And Working Capital Drivers
The cash conversion cycle, or CCC, is a metric that measures how long it takes for the cash that a business invests in operations to come back in the form of customer payments.
CCC is calculated using three other metrics: DSO, DIO, and DPO:
- DSO (Days Sales Outstanding): Measures how long it takes to collect cash after a sale is made.
- High DSO = cash is locked up in receivables longer (bad for cash position)
- Low DSO = cash is collected quickly (good for cash position)
- DIO (Days Inventory Outstanding): Measures how long inventory sits before it’s sold.
- High DIO = cash is tied up in unsold inventory (bad for cash position)
- Low DIO = cash is freed up quickly, improving liquidity (good for cash position)
- DPO (Days Payables Outstanding): Measures how long the organization takes to pay suppliers.
- High DPO = cash is preserved against immediate outflows (good for cash position)
- Low DPO = liquidity is drained quickly (bad for cash position)
Using these metrics, the CCC is calculated as follows:
CCC = DSO + DIO - DPO
So, if it takes longer to collect cash, and it takes longer to move inventory, that hurts your cash position. But, if it also takes time for your vendors to collect on payments, that helps your cash position.
This can work to your advantage. Achieving a better cash conversion cycle can be as simple as tightening collections by a few days (reducing DSO) or renegotiating payment terms with vendors (increasing DPO). A better cash conversion cycle leads to a better cash position and healthier liquidity for your organization.
Inside A Best-In-Class Daily Cash Position Report
As we’ve explained, cash position is a common and useful metric for finance teams to report on. The way this reporting is done varies by organization, but there are key elements that any daily cash position report should include.
Note that the cash position report is more than a simple static bank balance export. It should include additional analysis and insights (like availability, constraints, comparisons, and projections) that make it a forward-looking management tool, rather than a backward-looking data point.
Components Of A Daily Cash Position Report
It’s important for teams to deliver consistent, structured reports that list essential information clearly. Although formatting can vary, most teams issue reports that include the following sections:
- Opening cash: Cash and cash equivalents available at the start of the day. Typically equivalent to the prior day’s ending balances.
- Forecasted and actual inflows: Cash expected to come in during the day, and what actually came in (including customer payments, interest, and other receipts).
- Forecasted and actual outflows: Cash expected to leave during the day, and what actually left (including payroll, vendor payments, taxes, and debt service).
- Ending cash: Cash and cash equivalents at the end of the day, after accounting for inflows and outflows.
- Available borrowing capacity: The amount of cash that could be accessed immediately through credit lines or other facilities.
Within each of these sections, it’s also best practice to segment cash by entity, bank, and currency. These segmentations are critical; having cash attached to a certain entity or in a given currency can directly affect its availability, and therefore impact your cash position.
Many teams also choose to clearly separate and label restricted vs. unrestricted cash. This provides an easy way for management to differentiate between cash that can be deployed freely, and cash that can’t. Ultimately, this differentiation is why cash position reporting (beyond the static balance sheet) is necessary. Clear segmentation drives value.
Finally, your report may also include variances in the cash position or in specific balances, either relative to the prior day or relative to short-term forecasts. This helps surface trends early and gives stakeholders a data-driven view into why these trends may be taking shape.
Looking to build not just cash reports, but many types of management reports for your stakeholders? Read up on the 8 types of reports teams are building using Numeric today.
Data Sources And Cut-Off Times
While they’re not always top of mind for your audience, details like which data sources you used to generate the cash position report or the specific cut-off times for the data presented are worth documenting. Creating consistency around these details (for instance, always using 10 a.m. local time as your cutoff, unless otherwise indicated) is also key for ensuring that stakeholders are deriving as much value as possible from your reports.
Data sources might include bank feeds, the general ledger in your ERP system, AR and AP subledgers, payroll and tax systems, payment processors, or corporate card systems. Labeling these data sources increases transparency and accountability, and over time will make your report more reliable in the eyes of stakeholders.
Building A Cash Position Process Across The Close And Forecast
Cash position reporting provides value on its own, but it’s also a useful component of other accounting activities. The most effective teams integrate cash position reports into other workflows like the month-end close, reconciliations, and FP&A. Teams who treat the cash position report as a standalone spreadsheet risk losing confidence in forecasting and missing opportunities to uncover meaningful variance.
Here’s how to build a cash position process that will augment your close and forecast workflows.
Linking Daily Cash To Bank Reconciliations And The Close
The reliability of your cash position depends on the accuracy of internal cash account records. By regularly reconciling these records with external evidence, you can create confidence in your cash position figures and create opportunities to detect material discrepancies.
Unresolved reconciling items can distort your cash position reporting and make it difficult for stakeholders to understand your organization’s true liquidity.
Integrated systems, like Numeric’s cash and close modules, work together to prevent this problem; cash matching feeds reconciliations, which tie directly into the close checklist. Controllers can identify exceptions quickly (with little or no spreadsheet wrangling required) and reconcile between internal and external accounts to arrive at a clear cash position calculation.
Integrating Cash Position With Short-Term Forecasting (13-Week View)
Cash position reporting is generally backward-looking, and it doesn’t necessarily help stakeholders understand where the organization’s liquidity is headed in the short term. That’s why many teams use a rolling 13-week direct cash forecast to complement cash position reporting.
Here’s how it works: assume that today’s cash position is week zero. Your objective is to project inflows and outflows over the next 13 weeks, resulting in a reasonably accurate short-term liquidity forecast.
For inflows, start with open AR and expected collection dates. Refine the timing using historical customer payment behavior, and account for customer concentration, so that delays or shortfalls in a small number of payers factor into the forecast.
For outflows, start with payroll and related compensation, which are fixed and easy to forecast. Then, model AP payments using approved bills, payment terms, and real payment behavior. Tax payments must also be scheduled around statutory due dates. Because this is a short-term tool, capex should be forecast based on approved projects and expected payment milestones, rather than total cost. Together, these outflows define the organization’s fixed cash commitments.
To upgrade your forecast from a discrete analysis into a repeatable workflow, incorporate feedback loops. Use each day’s actual cash position to update the forecast, and take the opportunity to run root-case analysis on any material variances.
Over time, this will result in a forecast that reflects your organization’s cash flows and complements your regular cash position reporting. However, it’s risky to concentrate your team’s workload at the beginning or end of the month, when they may be busy with other period-end close activities. Instead, continuous accounting helps distribute cash-related tasks throughout the month and is a popular approach for modern accounting teams.
Communicating Your Cash Story To Execs
The role of the accountant is changing across all types of organizations. Simply providing numbers and issuing reports isn’t enough; the modern finance team helps translate data into coherent narratives, forecasts, and action plans. Cash position is no exception, and stakeholders are increasingly looking to their finance team to decipher cash data into compelling strategic insights.
Tailoring Views For Different Stakeholders
The story you tell will depend on your audience.
Executive teams, for example, care about the immediate health of the business. Headline cash, runway, headroom under debt covenants, and near-term liquidity risks are therefore top of mind. Meanwhile, lenders or boards may be more concerned with long-term growth or risks, making stress tests, downside scenarios, or policy impacts on liquidity potentially more compelling.
Keeping your audience in mind, consider creating a set of recurring charts and tables that stakeholders can refer to for an apples-to-apples comparison. Daily cash trend, forecast vs. actual, or days cash on hand are suitable metrics to track, and are sufficiently impactful to the organization to warrant deeper variance analysis in key cases.
Need helpful cash dashboarding? Turn to Numeric’s Cash Management to help.
As a final touch that will help your insights resonate even more clearly (especially with internal operational leaders), you can frame cash position metrics in terms of “room” for hiring, marketing spend, or capex. This brings the data to life and connects it to your audience’s day-to-day concerns.
Using Analytics And Flux To Explain Cash Movement
Flux analysis is another useful backward-looking tool for understanding how cash moved across your organization’s accounts. Examining changes across cash, AR, AP, and key expense accounts can help tell the story of what happened in a given period, and drafting narratives based on flux is easier than ever with the help of AI tools like Numeric.
Additional value can be created through careful documentation of “lessons learned” from significant positive or negative cash swings. Cash-related surprises shouldn’t be thought of as one-off anomalies, but rather learning opportunities. Your analysis should try to answer:
- What specific event or decision triggered the cash swing?
- Which assumption in the forecast proved incorrect or incomplete?
- Was the cause internal (process, approval, execution) or external (customer behavior, vendor action, regulatory timing)?
- Is this a one-time event or a recurring pattern?
- Could the swing have been predicted with existing data? If so, what signal was missed?
- What policy, forecast logic, or data source should be updated as a result?
The most effective teams understand that flawless forecasting is an unrealistic goal, and instead strive for iterative improvement based on repeatable workflows and cadences. That’s why analysis after the fact is just as important as thoughtful forecasting.
However, analysis is time-consuming, and until you’ve demonstrated proof of concept, it’s difficult to justify additional headcount for your organization’s accounting team. Many teams prefer to leverage tools like Numeric, which allow them to produce board-ready insights derived from cash position data on a continuous basis.
Tools And Automation For Real-Time Cash Position Visibility
Spreadsheets still power a vast amount of work across accounting teams. But spreadsheet-based workflows are gradually being replaced with API-connected, AI-enhanced processes. Most teams are somewhere in the middle of this spectrum in 2026, with modern tooling gaining adoption and earning more trust each year.
So: what does “good” look like in today’s context?
The Limits Of Spreadsheet-Only Cash Tracking
Bank exports and spreadsheets work well for cash position reporting. They’re low-cost, flexible, and offer immediate control (meaning team members can easily manipulate data and logic). If your team had infinite bandwidth, there would be no need to invest in anything else.
The duo becomes unwieldy at scale, however. Organizations that deal with many entities, currencies, or accounts quickly run into trouble without integrations or automation (which spreadsheets can’t offer). Moreover, any business that does meaningful transaction volume is taking a significant risk by trusting spreadsheets to track cash movements.
Even more troubling is the fact that organizations may not realize how much value they’re sacrificing by relying on spreadsheets and exports. Modern systems include features that are difficult to fully appreciate without firsthand experience, like real-time visibility, robust audit trails, or consistent application of matching and classification rules. Teams who haven’t seen the time and effort savings created by these tools may not know what they’re missing.
What To Look For In Modern Cash Position Tools
Modern cash position tools, on the other hand, come equipped with features that a modern accounting team can’t live without:
- Direct or API-based bank feeds
- Multi-entity and multi-currency consolidation
- Customizable rules for matching and classification
- ERP and general ledger integration
They also offer features that improve your team’s project management capabilities. As a CFO or Controller, there’s no need to micromanage or “circle back” continuously when governance features are baked into your tools. Features like role-based access control and clear audit logs (that tell you who changed what, and when) allow you to create accountability and visibility without overburdening yourself as a manager.
This last point is key. Accounting tools are supposed to make your life as a manager easier, and shouldn’t create an additional, challenging workload. If you’re in the process of evaluating such tools, consider asking vendors about match rates achieved in practice (Numeric attains a stellar match rate, as Brex can attest), what it takes to adjust rules, support for exception workflows, and time to initial go-live. Clear answers to these questions will give you peace of mind when it comes time to kick off the integration process with the vendor you eventually select.
How Numeric Supports Cash Position Management
Numeric supports cash position activities by solving for the data disconnection and similar pain points that have kept teams from generating accurate, timely reports and insights.
With a seamless ERP integration to NetSuite and a report builder that public teams love, teams on Numeric find building reports and creating clarity on cash position to be easier than ever before.
With Numeric, you can use AI-powered cash matching to cut down the time required for reconciliations. You can program automated journal entry posting back to your ERP. You can even take advantage of AI-powered flux analysis processes, to better understand movement in your accounts, cash or otherwise. account reconciliations.
Better cash position clarity begins with one system that does it all.
Moving from Spreadsheets to Strategy
The cash position is a central pillar of any organization’s financial health, and understanding the cash position is a key responsibility for finance teams and leadership.
A disciplined cash position process includes:
- Clear definitions and metrics for accounts and transactions
- A daily reporting workflow
- Tight integrations with both period-end close and forecasting functions
- Automation where it make a difference
Controllers and CFOs no longer need to settle for manual, spreadsheet-based cash workflows. Modern tools make it simple to gain visibility into your organization’s cash, and even provide real-time insights with no additional headcount required.
As the role of accounting teams evolves, the expectation is shifting to proactive partnership, rather than reactive reporting. Living up to this standard depends on implementing accurate, repeatable workflows that take advantage of integrations and automation. The right tools can bring that end state within reach,
Learn more about how Numeric approaches cash position management and unlocks value for customers by booking a demo today.
Related Content
.png)
Numeric vs. Ledge: What's the Best Close Platform for Your Business?
A detailed comparison of Numeric and Ledge, two modern close management platforms, covering features, architecture, pricing, and a framework for choosing the right fit for your team.
.png)
What is Record to Report: Process, Steps, and Benefits
Learn how the Record to Report process works, from transaction capture to financial reporting. Discover steps, challenges, automation strategies, and best practices for modern accounting teams.
.png)
Cash Runway In 2026: Formula, Analysis, And How To Extend It
Learn what cash runway is, how to calculate it correctly, how to analyze and extend it, and why reconciled cash data is the foundation of a trustworthy runway number.