Profitability Analysis for Controllers: From Close Execution to the Margin Conversation

.png)
The CFO asks for a margin breakdown by product line. The data is all in NetSuite — but pulling it into something defensible means hours of saved searches, manual exports, and spreadsheet work that won't happen until after close. By then, the conversation has moved on.
This is the gap profitability analysis is supposed to close. Done well, it shows exactly which products, customers, and business units are driving that number, and which ones are working against it.
This piece walks through how to build a profitability analysis that holds up: the right frameworks for breaking down margin by segment, the variance analysis methods that explain the shifts, and a path from raw close data to insights your business can act on.
Key Takeaways
- Profitability analysis breaks down margin by segment — product, customer, channel — so the numbers point to decisions, not just outcomes.
- Consolidated financials hide as much as they reveal; healthy net income can mask a segment quietly eroding long-term value.
- Variance analysis is where the CFO's questions live — decomposing gaps into volume, price, mix, and cost is what separates reporting from insight.
- Controllers who make this a monthly workflow change the nature of the conversations they're included in, not just the speed of the answers.
- AI-powered variance analysis and transaction-level reporting turn profitability analysis from a close-week scramble into a reliable monthly deliverable.
What Is Profitability Analysis?
A P&L tells you the score. Profitability analysis tells you which players are responsible for it — and which ones are costing more than they contribute. It uses financial ratios and segmented performance data to break down profit generation at a granular level. You get the breakdown by product, customer, channel, or business unit so the numbers point to decisions, not just outcomes.
A business can post a healthy net income while a single underperforming product line erodes long-term value. Profitability analysis is how you find that before it grows into a bigger problem.
Why Profitability Analysis Matters — Especially for Lean Finance Teams
Profitability analysis is the mechanism by which finance leaders move from explaining what happened to shaping what happens next. For controllers running lean teams, it's also the clearest path to the strategic credibility that close execution alone will never provide.
Identifying Which Segments Are Actually Worth Growing
A product line generating $5 million in revenue at a 6% gross margin may be consuming more resources than one generating $2 million at 48%. Profitability analysis makes those comparisons explicit — and gives leadership the data to double down on high-margin segments rather than optimizing for revenue volume at the expense of margin quality.
That same logic applies at the board level. A company growing revenue 40% year-over-year while gross margins compress from 68% to 61% is telling a different story than its top line suggests. And sophisticated investors will spot margin compression before management presents it.
Anchoring Planning Cycles in Performance Reality
The profitability data a controller surfaces opens new conversations. FP&A teams rely on it to build forecasts grounded in actual margin drivers — volume, price, mix, and cost. The most effective scenario models tie projections to operational variables like unit volume, headcount, and capacity utilization rather than to top-line growth rates. For controllers, this is the handoff that earns a seat in the planning conversation.
Key Profitability Metrics and Ratios
Every profitability analysis rests on a core set of ratios — each measuring a different dimension of how efficiently the business converts inputs into profit.
Margin ratios work down the income statement, showing how much profit survives at each stage.
Return ratios shift the lens to the balance sheet, measuring how much profit the business generates per dollar of capital deployed. Used together, they give a complete picture of both operational performance and capital efficiency.
A SaaS company at $10M ARR posting 72% gross margin and 9% net margin looks healthy on the surface.
But if ROIC sits at 6% against a 12% cost of capital, the business is destroying value on every dollar deployed — usually a sign that onboarding or infrastructure spend isn't being recovered in pricing. That's the signal to audit the expansion segment.
How to Conduct a Profitability Analysis: Step by Step
Most profitability analyses fail because the data isn't clean enough or the work lands after close when the window to act has already shut. See how to do it properly, step by step:
- Define scope and segments — Decide whether the analysis runs at the company level or is broken down by product, customer tier, channel, or geography. This decision shapes every data pull and methodology choice that follows. Vague scope produces vague output.
- Gather and clean financial data — Pull revenue, COGS, operating expenses, and capital data from your ERP, general ledger, CRM, and billing systems. The quality of what comes out is only as good as how costs — especially shared and indirect ones — are allocated going in.
- Calculate profitability ratios — Apply gross, operating, net margin, ROA, ROE, and ROIC across each segment. The goal is a ranked view of where the business actually makes money.
- Conduct variance analysis — Compare actuals against prior periods, the budget, and the forecast. Decompose the gaps into volume, price, mix, and cost variances. This is the step most teams skip or compress. And it's where the CFO's real questions live.
- Segment and rank performance — Rank products, customers, or business units by margin contribution. The bottom of that list is usually where the most actionable decisions are hiding.
- Model what-if scenarios — Once the variance picture is clear, simulate the margin impact of a price increase, a product exit, or a shift in customer mix before committing resources. Tie projections to operational variables, not flat percentage assumptions. This moves the analysis from a backward-looking report to a forward-looking decision tool.
- Translate insights into action — Present findings with clear recommendations: where to invest, where to reprice, where to cut. Analysis that doesn't end in a decision has a short shelf life in a CFO conversation.
Variance Analysis as the Controller's Sharpest Tool
Variance analysis decomposes the gap between actual and expected performance into its root causes. A favorable revenue variance could reflect higher volume, better pricing, or a richer product mix — and each has a distinct strategic implication and owner.
Mix variance is the most overlooked of the four. Consider a company that grows revenue 12% while shifting volume toward lower-margin SKUs. Gross margin falls 180bps with no price changes and no cost increases. It won't show up as a price problem or a cost problem. It only surfaces if you decompose the variance correctly.
A distribution company running $40M in revenue saw gross margin compress from 31% to 28.5% over six months despite flat input costs and stable pricing. The cause: three high-volume, low-margin SKUs introduced for a major account had quietly grown to 22% of revenue. No individual decision triggered the compression — the mix shifted underneath it.
Finance teams that run systematic variance analysis monthly build a feedback loop that sharpens forecast accuracy and accelerates the operational response time their CFO expects.
Surfacing Variance Explanations Without the Spreadsheet Sprint
The workflow breaks here for most lean teams: variance analysis is critical, but doing it manually — after close, under time pressure — means it consistently happens too late to make a difference.
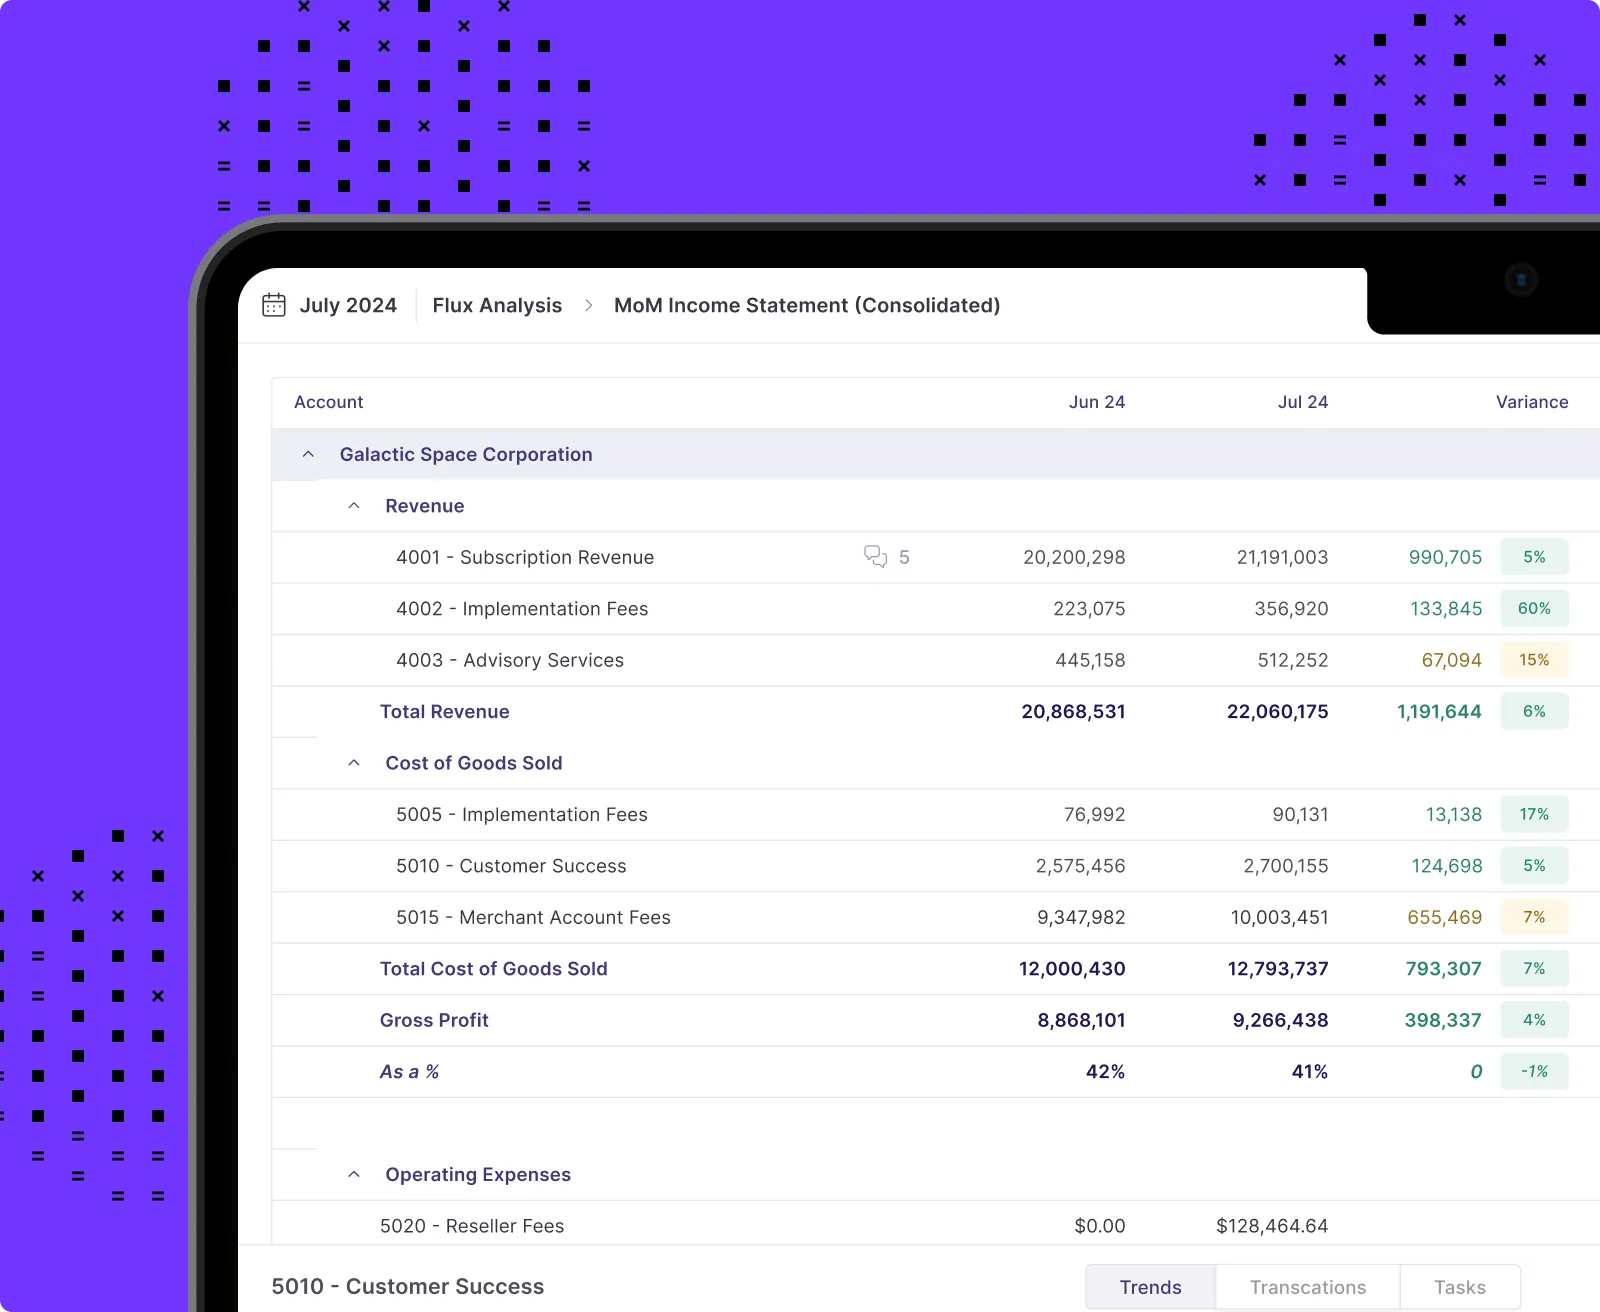
Numeric's Flux Analysis combs through accounting data, identifies what changed since prior periods, and automatically drafts explanations — turning a multi-hour process into a reviewable output the controller edits and presents. When the CFO asks why software costs spiked 18%, the answer is already surfaced, not buried in a saved search.
Types of Profitability Analysis by Business Segment
Segment-level profitability analysis is where the real strategic value surfaces. A business that looks healthy at the consolidated level may be masking one highly profitable segment subsidizing several loss-making ones. It's a pattern that, if undetected, compounds into a structural disadvantage over time.
Customer Profitability Analysis
At a B2B SaaS company, the 10 largest accounts by revenue contributed 60% of gross profit. Three of them were operating at negative margin once onboarding, dedicated support, and custom development costs were fully allocated. Retention and expansion resources had been flowing to those accounts based on revenue size, not profitability. That's what this analysis exists to correct.
Identifying high-LTV, high-margin customers lets sales and marketing refine acquisition targeting, optimize retention investment, and build pricing structures that reflect actual cost-to-serve. This analysis is particularly high-impact in B2B businesses and subscription models where onboarding costs are high and front-loaded.
Product Profitability Analysis
A product line posting $2M in revenue at 40% stated margin may land at 18% true margin once returns, packaging, and allocated warehouse costs are factored in — making it a candidate for repricing.
Product profitability analysis assigns all direct and allocated costs to individual products or SKUs to calculate the true margin. The challenge is cost allocation: shared overhead, logistics, and returns must be assigned based on actual resource consumption, not arbitrary percentages. Without it, the product lines that look profitable on paper are often the ones quietly subsidizing the ones that aren't.
Building Segment-Level Profitability Reports Without ERP Administration
Getting to segment-level profitability data in NetSuite typically means building custom saved searches or paying for ERP administration time that most lean teams don't have.
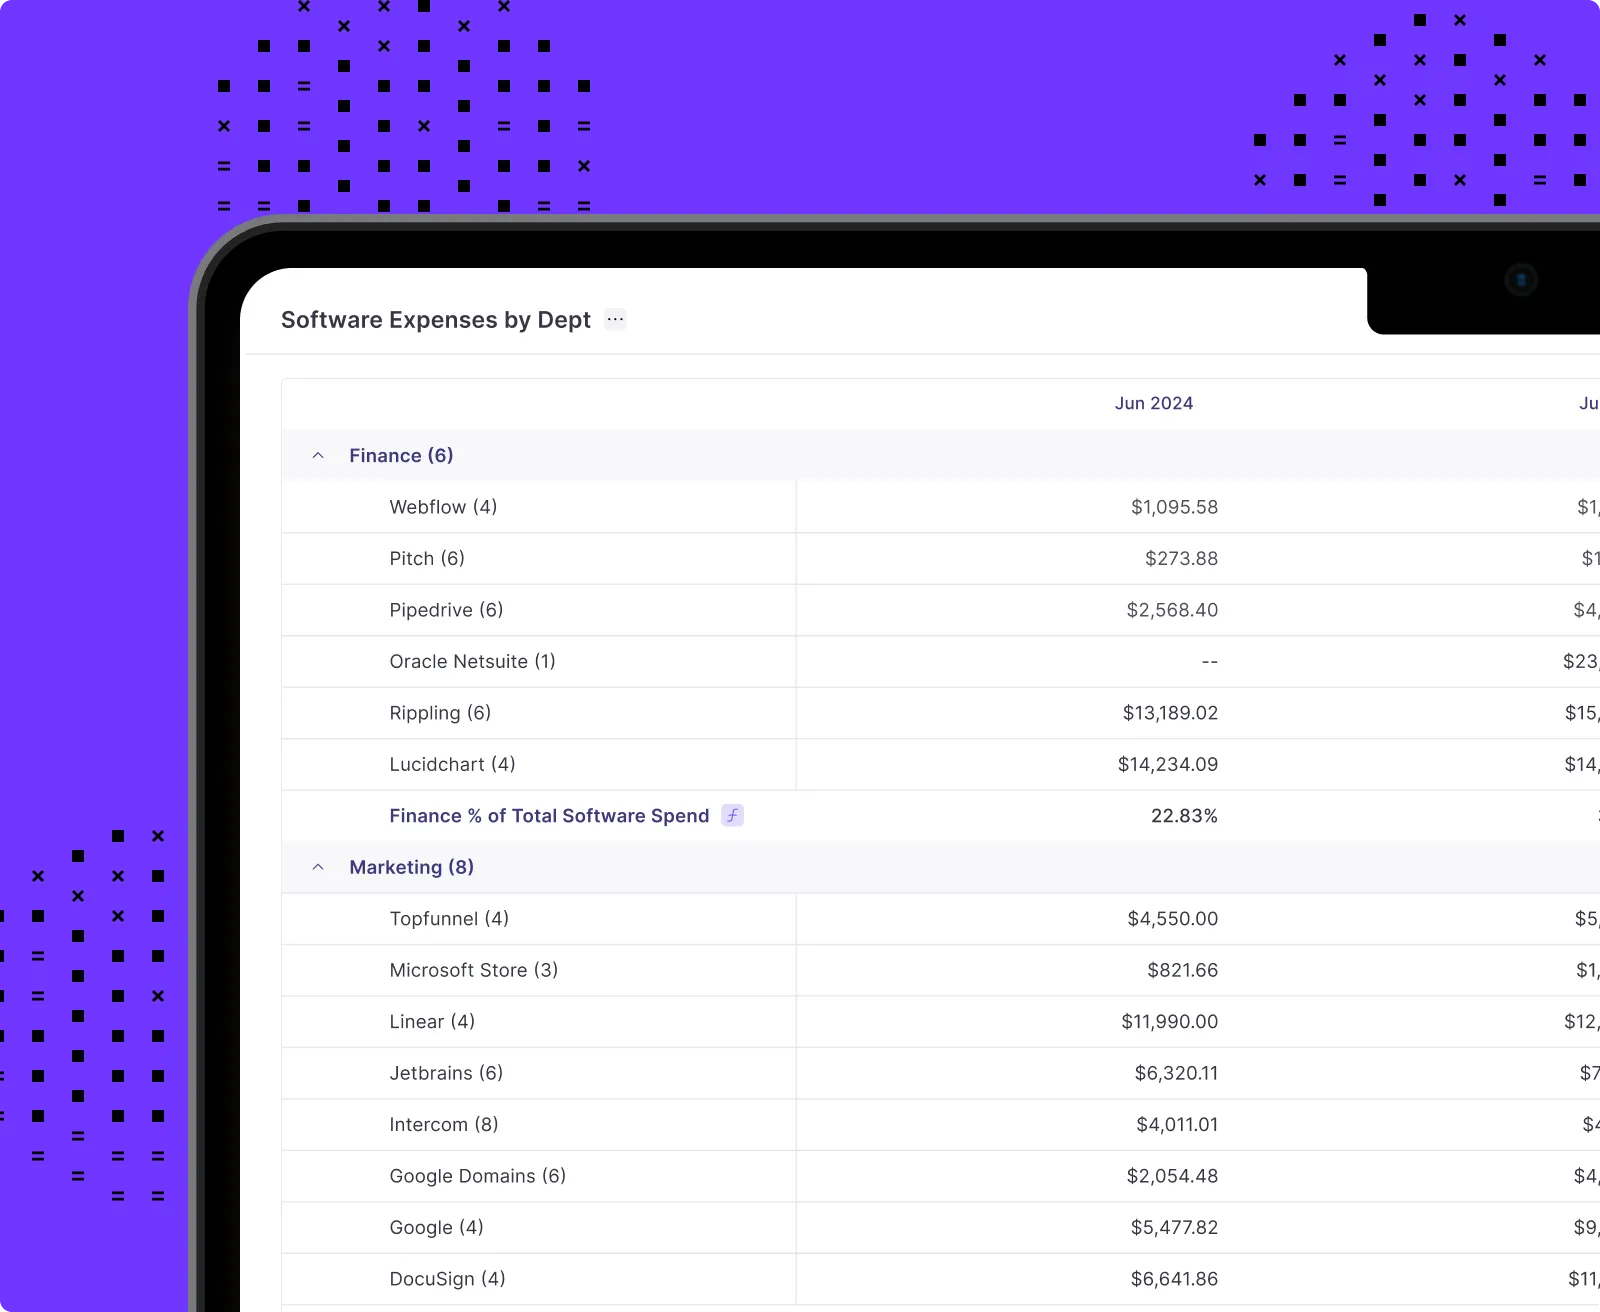
Numeric's Custom Report Builder lets controllers slice transaction data by entity, department, class, or location — and pivot it the way a business question actually demands — without needing system admin credentials or consulting hours.

Common Profitability Analysis Mistakes — and How to Avoid Them
The most dangerous mistakes are baked into the methodology and compound over time.
- Arbitrary cost allocation. Splitting shared overhead equally across all products distorts segment margins and makes unprofitable lines appear healthy. Audit your allocation method once per year — if indirect costs are split by headcount, verify that headcount data is current and actually reflects resource consumption.
- Analyzing a single period in isolation. One quarter of data without trend context is a snapshot, not an analysis. A 42% gross margin means nothing without knowing it was 48% six months ago. Always run the same analysis against at least three prior periods. Direction matters more than the absolute number. For guidance on setting the right thresholds for your review, see how to calculate materiality thresholds.
- Conflating revenue growth with profitable growth. A business unit growing 30% year over year can still be dilutive to overall profitability if its margins fall below the company's cost of capital. Report segment margin alongside segment growth in every CFO update.
- Excluding non-cash costs. Depreciation, amortization, and stock-based compensation are real economic costs. At a company with $8M in annual SBE, excluding it means presenting a 14% operating margin to a board that's looking at 6%. Run a GAAP vs. adjusted margin bridge explicitly — don't let the board discover the gap themselves.
- Using only top-line financial data. Pairing financial metrics with operational data — customer retention rates, support ticket volumes, fulfillment costs per order — improves explanatory power and surfaces problems that the numbers alone won't reveal.
- Treating the analysis as the deliverable. A profitability analysis that generates insights but doesn't translate into a decision within a defined timeframe erodes credibility. Finance teams that produce analysis without follow-through train their stakeholders to stop asking. Every output should end with one recommendation, one owner, one deadline.
Making Profitability Analysis Part of the Monthly Workflow
Instead of presenting what happened after close, the controllers who do this well model what could happen before decisions are made. That shift is what continuous accounting is built around. It comes from solving the data access problem that makes the work arrive too late to matter.
Numeric is built for exactly that gap. It connects directly to NetSuite to surface transaction-level data in real time, automates the variance analysis that historically consumed close week, and gives controllers a reporting layer — including pre-built Claude Skills via Numeric's MCP — they can use without needing ERP administration support.
The result is that you show up to the CFO conversation with the analysis already done. Curious about Numeric? Schedule a demo today.
Frequently Asked Questions About Profitability Analysis
Related Content

Numeric Hosts The First Finance Engineer Cup
Four accountants built real AI tools for their own close and competed live. See how Alexandria Ramirez won Numeric's first Finance Engineer Cup.

The Finance Engineer: Why Accountants Are the Best Builders in the Room
Why accountants, not engineers, are becoming the best builders on modern finance teams. Meet the Finance Engineer.
.png)
Numeric vs. Ledge: What's the Best Close Platform for Your Business?
A detailed comparison of Numeric and Ledge, two modern close management platforms, covering features, architecture, pricing, and a framework for choosing the right fit for your team.