NetSuite Custom Reports: How to Build Your Own

.png)
Standard NetSuite reports are built to serve every customer, which means they rarely serve any one team exactly. A GAAP-formatted income statement does its job at month-end, but you could still be left scrambling the second your CEO asks what you spent with a single vendor last quarter. So you customize it, or you export to Excel, rebuild the view you wanted, and repeat the exercise next month.
Permissions make it worse. Plenty of accountants can run a report but can't modify one, which turns a two-minute column change into a ticket for whoever holds the right role.
This guide covers the four native tools NetSuite gives you for custom reporting, walks through building and customizing a report step by step, explains why financial statements work differently, and marks the point where native reporting runs out of room.
Key Takeaways
- NetSuite offers four native reporting tools: Report Builder for most standard and ad hoc reports, Financial Report Builder for financial statements, Saved Searches for transaction-level queries, and SuiteAnalytics Workbook for pivot-style analysis.
- Reports win on presentation and financial statement structure. Saved searches win on complex filtering, joins, and email alerts. Picking wrong costs you an afternoon.
- The fastest path to a custom report is modifying an existing standard report rather than building from scratch.
- You don't need the Administrator role to build custom reports. You need the Report Customization permission, plus the Financial Statements permission for financial statements specifically.
- Native reporting hits real walls on period-over-period comparisons, rollforwards with beginning balances, and budget-versus-actual analysis. Those gaps are where teams reach for Excel or a reporting layer on top of the ERP.
What Are Custom Reports in NetSuite
A custom report in NetSuite is any report you've modified or created yourself. You might add a column, restrict results to one subsidiary, regroup the data by department, or build something entirely new from a chosen data metric.
The practical appeal is self-sufficiency. Once you have the right permission, adjusting columns, filters, sorting, and grouping happens in a point-and-click interface with no scripting and or IT ticket that can get lost in the queue. You save the result, and it's there next month with the same structure and refreshed data.
Standard Reports vs Custom Reports in NetSuite
The difference between standard reports and custom reports comes down to who defined the output.
Standard reports are the prebuilt templates NetSuite ships with, covering common financial and operational needs. Custom reports either reshape and customize those templates, or could be new reports that you've defined from scratch.
FeatureStandard ReportCustom ReportPre-configured on deliveryYesStarts from a standard report or a chosen metricEditable columns and filtersNo, beyond footer optionsYes, through the Report BuilderSaved for reuseAvailable to all permitted usersSaved under your own name and audience settingsRequires customization workNoneSetup time up front, reusable after
Most teams end up with a small library of custom reports that mirror how they actually run the business, sitting alongside the standard reports they use for statutory reporting.
| Feature | Standard Report | Custom Report |
|---|---|---|
Pre-configured on delivery | Yes | Starts from a standard report or a chosen metric |
Editable columns and filters | No, beyond footer options | Yes, through the Report Builder |
Saved for reuse | Available to all permitted users | Saved under your own name and audience settings |
Requires customization work | None | Setup time up front, reusable after |
NetSuite Tools for Building Custom Reports
NetSuite gives you several tools that overlap enough to be confusing. Knowing which one to open before you start saves the most time, because moving a half-built report from one tool to another usually means starting over.
Report Builder
The Report Builder is the no-code interface for customizing most standard and ad hoc reports. You open it by clicking Customize on the Reports page or on the report itself, and it presents your work across a handful of pages: Edit Columns, Filters, Sorting, and More Options.

Each page does roughly what its name suggests:
- Edit Columns controls which fields appear and in what order.
- Filters restricts which records are included.
- Sorting controls row order.
- More Options handles report-level settings and audience.
Financial Report Builder
Financial statements get their own interface. The Financial Report Builder handles income statements, balance sheets, and cash flow statements, and its defining feature is the Edit Layout page.
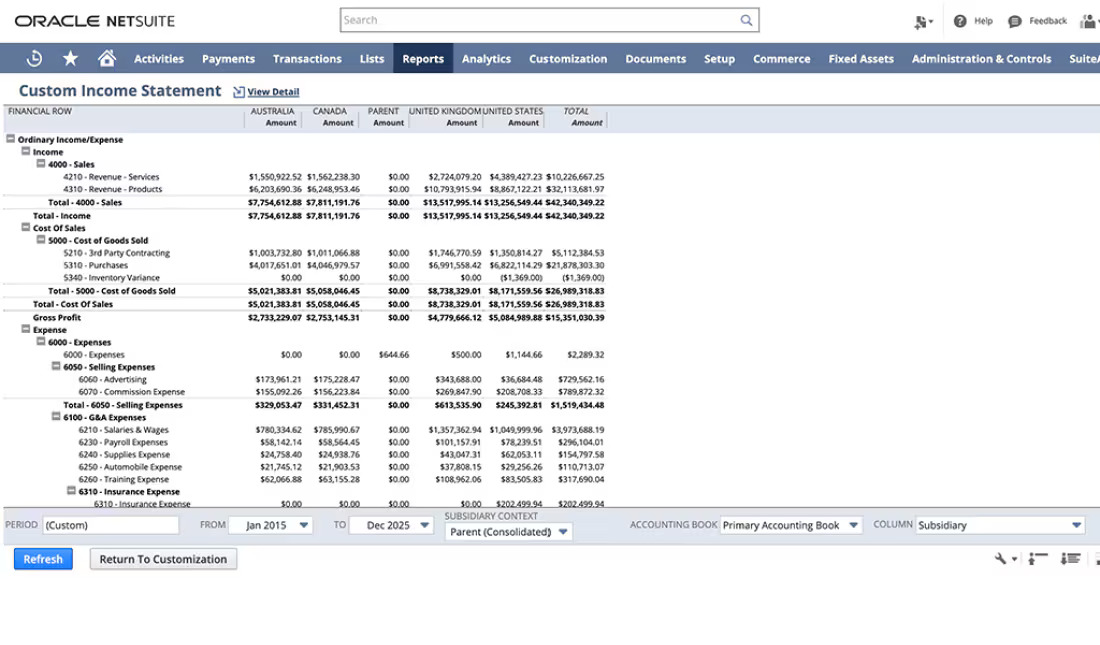
Edit Layout gives you row and section level control that the standard Report Builder doesn't offer. You can filter and group sections by account type, account name, account number, class, department, location, or subsidiary. This is what makes it possible to produce a statement that reads the way your finance team thinks rather than the way the chart of accounts happens to be ordered.
Saved Searches
Saved searches are queries against NetSuite records rather than formatted reports. Oracle's own documentation draws the line clearly: saved searches support more complex data manipulation and email alerts than reports do, but they don't offer the same presentation formatting.
That tradeoff is the whole decision. Reach for a saved search when you need transaction-level lists, multi-dimensional filtering, or joins across related records. Reach for a report when the output needs to look like a financial statement.
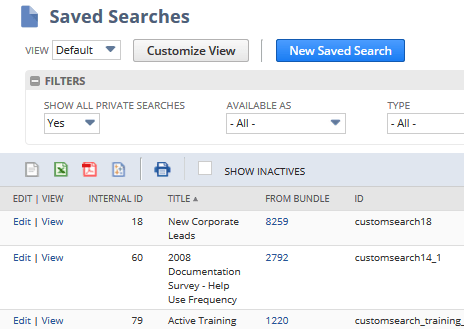
Saved searches also carry a learning curve that catches people out. As Numeric's Ultimate Guide to NetSuite explains, these are the gatekeepers of NetSuite reporting. If you know the right joins, field levels, and filter sequence, they open a shortcut straight to your answer. If you don't, they won't stop you. They'll hand you a broken report that looks perfectly fine until you notice the totals are double-counted.
Three concepts account for most of that pain:
- Record type determines what you can filter, display, and join to. Choose it first, because everything downstream depends on it.
- Joins let you reach from one record to a linked record. Everything before the colon is a joined record, everything after is a field or another join.
- Summary types (Group, Sum, Count, Maximum, Minimum, Average) control how rows collapse. If you apply one to a single field, you have to apply one to every field.
The related trap is the Main Line filter. A single vendor bill with five expense lines shows as one row when Main Line is true and five rows when it's false. Pair that line-level view with a header-level amount field and the search will count the full bill once for every line, inflating your totals fivefold.
SuiteAnalytics Workbook
Workbook is NetSuite's pivot-style analytics tool, built on the analytics data source. It supports multilevel joins across record types, custom formula fields, and linked datasets, all through a drag-and-drop interface.
The capability gap versus saved searches is significant. Workbook handles multi-level joins that saved searches can't build, and it produces pivot tables and charts directly in NetSuite instead of sending you to Excel. Trend analysis, period-over-period columns, and calculated measures all become possible. Whether it's genuinely easier to use is a separate question, since you're still navigating accounting concepts through NetSuite's technical data structure.
Dashboards and KPIs
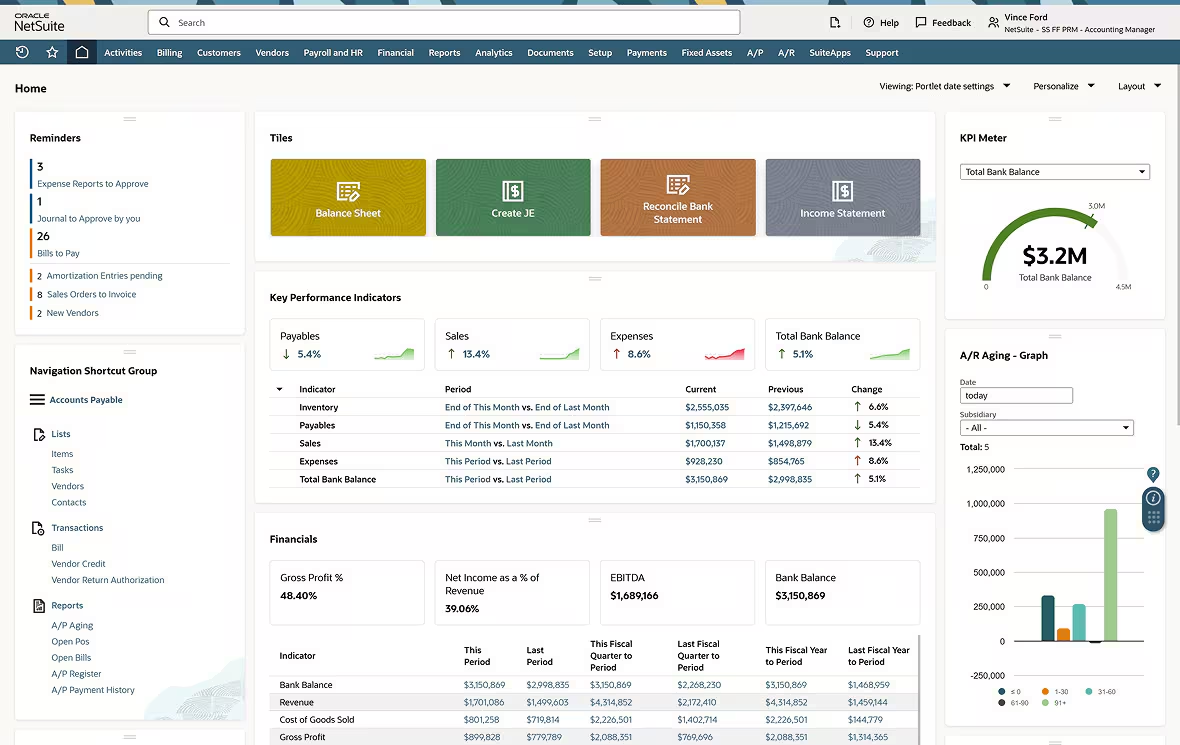
Dashboards turn saved reports and searches into something people actually look at. NetSuite dashboards are built from portlets, including report snapshots, over 75+ KPIs, and trend graphs, and they can be configured per role.
.jpeg)
For Controllers, this is the difference between a report that exists and a report that gets used. A well-built saved search surfaced as a dashboard portlet gives your team a standing answer to a recurring question without anyone rerunning anything.
How to Build a Custom Report in NetSuite
The fastest route to a working custom report is almost always modifying something that already exists. NetSuite ships with a large library of standard reports, and starting from one that's close to your target saves you from redefining metrics and column logic from scratch.
1. Choose a Starting Report or Report Type
Open the Reports tab and browse the categories until you find the closest match to what you need.
- Look for a report that already contains most of your target data, even if the grouping is wrong.
- If nothing fits, click New Report and select the metric you want to report on, then click More Customization to open the Report Builder.
- Remember that you can only customize reports you're able to run in the first place.
2. Customize Columns and Fields
Click Customize to open the Report Builder, then go to Edit Columns. This page shows a preview pane with every column on the report.
- Add fields by dragging them in from the field list on the left.
- Remove a column by selecting it in the preview and clicking the X.
- Rename column headings so the output makes sense to whoever receives it. A column labeled with an internal field name will generate questions every single month.
3. Apply Filters and Criteria
The Filters page controls which records make it into the report. This is where most reports go wrong, usually by being too permissive.
- Restrict by subsidiary, department, class, and location to match the slice of the business you care about.
- Set a date range that matches your reporting period rather than defaulting to something broad.
- Add filters one at a time and check the preview after each. Diagnosing a wrong number is much easier when you know which filter you added last.
4. Group, Sort, and Sub-Total Data
The Sorting page controls row order, and grouping determines where subtotals appear. Together they decide whether the report reads as a list or as an analysis.
- Group by the dimension your audience thinks in, usually department, account, or vendor.
- Add subtotals at each grouping level so the report answers questions without anyone reaching for a calculator.
- Sort within groups by amount when you want the largest items to surface first.
5. Preview, Save, and Share the Report
Preview before saving, then name the report in a way that distinguishes it from the standard version it came from.
- Use the footer options to export to CSV, Excel, PDF, or Word, and to drill into underlying transactions.
- Use the More Options page to set the audience if colleagues need access.
- Click Schedule in the footer to set up recurring emails. This opens the Schedule Report page, where you pick recipients, add a message, and set a recurrence. Scheduled reports live under Reports > Scheduled Reports > Report Schedules.
How to Customize a NetSuite Financial Report
Financial statements behave differently enough that it's worth treating them as a separate workflow. The Financial Report Builder replaces column-level thinking with layout-level thinking, which is closer to how accountants actually build a P&L.
Custom Layouts
A layout defines the overall skeleton of the statement: which sections appear and in what order. You can create a new layout or modify an existing one, and choose whether the statement runs on a cash or accrual basis.
If you use NetSuite OneWorld, layouts also let you produce separate custom financial statements per subsidiary, with country-specific layouts available for each one. For multi-entity teams, this is what keeps local statutory reporting from becoming a manual exercise.
Custom Sections and Rows
Sections are subsets of financial data, typically filtered and grouped by account type. On the Edit Layout page you can add sections, drag account rows into place, and organize the chart of accounts into groupings that reflect how leadership reads the numbers.
This is where a clean chart of accounts pays off. If your COA relies on segments for dimensional detail rather than duplicating accounts by department, your sections stay short and your statements stay readable.
Custom Formulas and Calculations
Formula rows let you add calculated lines that reference other rows in the statement, which is how you get metrics onto the face of the report instead of into a downstream spreadsheet.
Two examples that come up constantly:
- A gross margin row calculated from revenue and cost of revenue sections, expressed as both a dollar figure and a percentage.
- An EBITDA row that adds back depreciation, amortization, interest, and tax rows from the operating result.
Building these once inside the statement means every future period produces them automatically.
Types of Custom Reports You Can Build in NetSuite
Most custom reporting requests fall into one of two buckets, and knowing which one you're in tells you which tool to open. Financial reports are constrained by accounting standards, so they're relatively few and relatively stable once built. Operational reports answer whatever the business is asking this quarter, which is why they multiply quickly and why naming conventions matter.
Financial Reports
These are the statements and schedules that support the close and the audit, and they belong in the Financial Report Builder.
- Income statement, balance sheet, and cash flow statement
- Trial balance
- Aged receivables and aged payables
Operational Reports
These answer business questions rather than reporting requirements, and they're usually built in the Report Builder or as saved searches.
- Sales by region
- Inventory status
- Purchase order summaries
- Vendor spend analysis
Best Practices for Building Custom Reports in NetSuite
A custom report is a small piece of infrastructure. The habits below are what separate a library your team trusts from a pile of half-broken reports nobody remembers building.
- Start from a standard report. You inherit tested metric definitions and column logic instead of rebuilding them.
- Use clear naming conventions. "AP Aging by Department (Monthly Close)" tells the next person what it does. "AP Aging 3 FINAL v2" tells them nothing.
- Add filters incrementally and validate as you go. Confirm the data is right before layering on more restrictions.
- Document what you built and why. Saved searches have a description field for exactly this reason. Future you, and your auditor, will both benefit.
- Test with a narrow date range first. Large reports are slow to iterate on, and a one-month test surfaces logic errors faster than a full-year run.
- Watch header versus line level fields. Mixing them is the most common cause of double-counted totals in multi-line transactions.
Limitations of NetSuite Custom Reports
Native reporting covers a lot of ground, and it's worth being clear about where it stops so you can plan around it rather than discovering the wall mid-close.
- Performance degrades with volume. Scheduled reports that run longer than three minutes during peak hours are automatically disabled, and the owner gets a timeout email. The report won't run again until it's edited or rescheduled for off-peak hours.
- Multi-entity and multi-currency reporting demands careful filter setup. Subsidiaries with different chart of accounts structures don't consolidate cleanly, and getting it wrong produces plausible-looking numbers that are quietly incorrect.
- Transaction-level detail usually means leaving reports behind. Standard reports summarize. When you need the underlying lines, you're building a saved search, and saved searches carry their own constraints.
- Some analyses can't be built natively at all. Period-over-period variance with pivoted time columns, rollforwards that require beginning balances, and budget-versus-actual comparisons all run into structural limits, because saved searches have no concept of a period-opening balance and budget data lives in a record type with no natural join to transactions.
- Formatting is limited compared to external tools. Reports are functional rather than presentation-ready, which is why so many board packages still get assembled in Excel.
- Workbook data isn't always live. By default, pivot tables and charts in SuiteAnalytics Workbook cache after 60 minutes of inactivity, so what you're looking at may not reflect the last hour of activity unless you refresh or enable real-time response mode.
- Permissions gate who can build. The people closest to the question often aren't the people who can modify the report, which puts a queue between a business question and its answer.
NetSuite stores every transaction. Numeric makes it reportable.
Extending NetSuite Reporting With Numeric
Most of the limitations above share a root cause: NetSuite stores the detail you need but doesn't make it easy to reach. Numeric is a reporting and close platform that sits on top of the ERP, and closes those specific gaps with several features:
- Transaction-level detail without the export. Numeric pulls every transaction line from NetSuite, so you can move from a balance straight into the transactions behind it. The Excel round trip that saved searches force on you stops being part of the workflow.
- Flux analysis that starts drafted. Instead of downloading reports and rebuilding pivots each time the numbers move, Numeric's variance analysis works off the GL and drafts explanations for the changes it finds, leaving your team to validate rather than assemble.
- Pivots that native reporting struggles with. Reporting in Numeric lets you pivot by vendor, department, or class, group OpEx and revenue accounts to calculate operating margin, and set reports to recur as part of the month-end package.
- Reports built by AI, on request. Through the Numeric MCP, AI tools like Claude can assemble reports directly against your close data and general ledger — in fact, two-thirds of teams using the MCP have AI build report data from scratch.
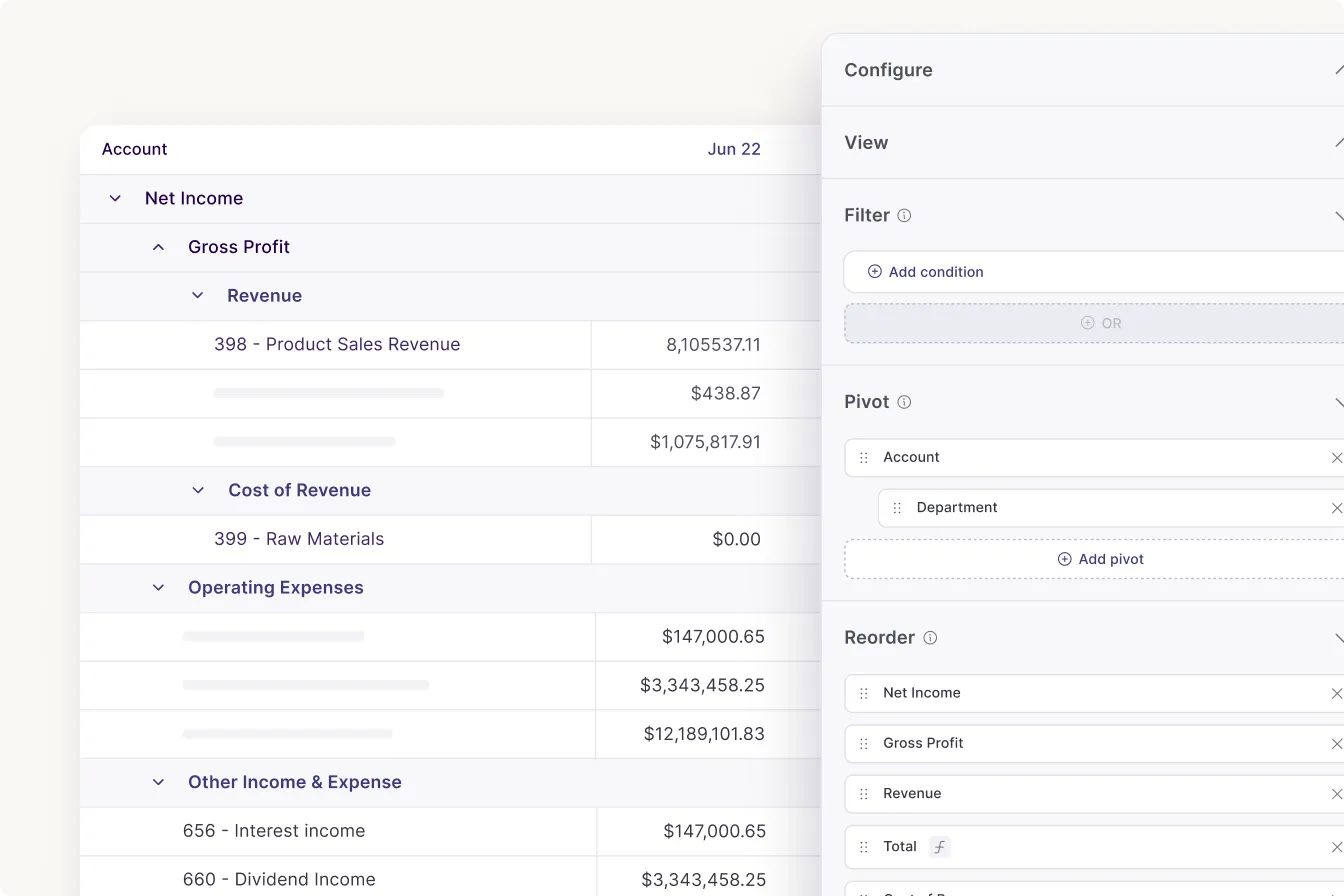
Riskified, a public company running on NetSuite, made reporting the primary reason they switched. Controller and Head of Global Bookkeeping Omri Modiano described the moment it clicked during the demo, when the platform pivoted every transaction by vendor and by department: "Now I don't need to download Excels anymore, I don't need to do everything manually. It's just one click away, and I can change the pivot immediately, I can see all the transactions, I can even click directly to NetSuite."
The permissions problem showed up for his team too. As a public company with SOX obligations, Modiano's own role in NetSuite is restricted enough that building reports in the native report builder is difficult. Working from the same data in Numeric removed that constraint without loosening any controls in the ERP.
For Controllers, the value lands in two places. Leadership questions get answered during the meeting instead of the following afternoon, and senior accountants stop spending their best hours exporting and rebuilding views they already built last month.
If catching data problems before they reach a report is the bigger concern, Numeric's transaction monitors run continuous checks against the GL and flag issues like missing department tags or miscoded expenses for your team to investigate.
Ready to see it in action? Schedule a demo to see what reporting looks like when every transaction line from NetSuite is already in front of you.
Frequently Asked Questions
The difference between a NetSuite report and a saved search comes down to presentation versus query power. Reports give you the structure, subtotals, and period columns financial statements require. Saved searches trade that formatting for complex filtering, joins, and email alerts, which makes them the better choice for transaction-level detail.
Yes, NetSuite custom reports are updated in real time. Reports and searches pull live data, so a saved report reflects the current state of the ledger each time you run it. The exception is SuiteAnalytics Workbook, where pivot tables and charts cache after 60 minutes of inactivity unless you refresh or switch to real-time response mode.
Yes, you can natively schedule and email NetSuite custom reports automatically. Click Schedule in the report footer, then pick your recipients, set a recurrence, and choose attachments. Two limits are worth knowing: recipients must be email addresses already tracked in your NetSuite account, and NetSuite emails are capped at 20MB.
No, you don't need administrator access to build custom reports in NetSuite. You need the Report Customization permission, which Oracle recommends assigning at the FULL level, since lower levels either hide the Customize links or block you from saving. Financial statements additionally require the Financial Statements permission, and no permission level lets you customize a report you can't already run.

Related Content
.png)
Expense Allocation in Accounting: From Shared Costs to True Margins (and Why the Usual Methods Break)
Learn what expense allocation involves, why it's essential for fully loaded P&Ls and true margins, and why spreadsheet models and aggregate JEs keep failing, plus how to fix the root cause.
.png)
Multi-Entity Consolidation: What It Involves, Why It Breaks, and How to Fix It
Learn what multi-entity consolidation involves, why it breaks as companies grow, and why both Excel and add-on tools share a structural flaw. A guide for controllers and VPs of finance.
.png)
How to Build an AI Audit Trail for Your Accounting Workflows
A practical guide to AI audit trails for accounting: what to capture, why SOX, PCAOB, and GAAS require traceability, and how to audit AI agents and skills, not just AI features bolted onto your close software.