NetSuite Reporting Limitations: Why Native Reports Break Down As You Scale

.png)
NetSuite's reporting holds up well for standard financial statements and simple filtered lists, then strains on the work finance actually gets asked for, meaning consolidated packs, transaction-level detail, and any view that crosses modules. Those are the reports that get assembled in Excel every month, and the ones that quietly truncate at their row limits until a number fails to tie.
Most teams read NetSuite reporting limitations as a tooling gap and try to close it with an add-on, a BI layer, or another round of saved searches. Each of those helps for a quarter or two before the same wall shows up again, because the deeper limits trace back to how NetSuite's general ledger stores data in the first place.
This article covers what NetSuite's native reporting can and can't do, why it gets harder as you scale, what teams try first and where those fixes plateau, and what a structurally different approach looks like.
Key Takeaways
- NetSuite reports truncate at 100,000 rows on demand and 1,000,000 in the background, and saved searches need scripting for deeper logic.
- NetSuite consolidates statements natively, yet the monthly leadership pack usually gets assembled in Excel from exported trial balances.
- These limitations compound as entity count, transaction volume, and reporting demands grow.
- SuiteAnalytics Connect, BI layers, and more saved searches buy time while leaving the underlying structure untouched.
- Numeric's Financial Data Platform keeps every business event as a full object, so any dimension can be reported on directly.
What Can NetSuite's Native Reporting Do, And Where Does It Stop?
NetSuite gives you two native paths for reporting. Standard reports, including the financial statements, cover the formatted output a close needs, while saved searches query records directly for transaction-level lists and filters. Both are built so everyday reporting doesn't require a developer, and for most questions at a single entity they deliver on that promise.
Five limits account for most of the friction teams run into:
| Limit | What happens | Where it hurts |
|---|---|---|
Report row limits | Reports cut off at 100,000 rows on demand or 1,000,000 in the background | Large GL detail reports during close |
Saved search logic | Joins, calculated fields, and formatting usually need scripting | Anything past a basic filtered list |
Module boundaries | Reports stay inside the GL, AP, or CRM | Cross-functional views like revenue by segment |
Native dashboards | Visualization options are limited | Board and leadership reporting |
Consolidated reporting | Statements consolidate natively, while some views have hard gaps and the monthly pack gets built outside NetSuite | Board packs and multi-entity close |
NetSuite Report Row Limits And What Happens When You Hit Them
NetSuite measures report size by the number of database rows it retrieves, which can run higher than the rows you actually see once results split across classifications. Oracle documents the ceilings at 100,000 rows for a report run on demand and 1,000,000 for one run in the background, meaning scheduled, emailed, or exported, and results past those limits get cut off.
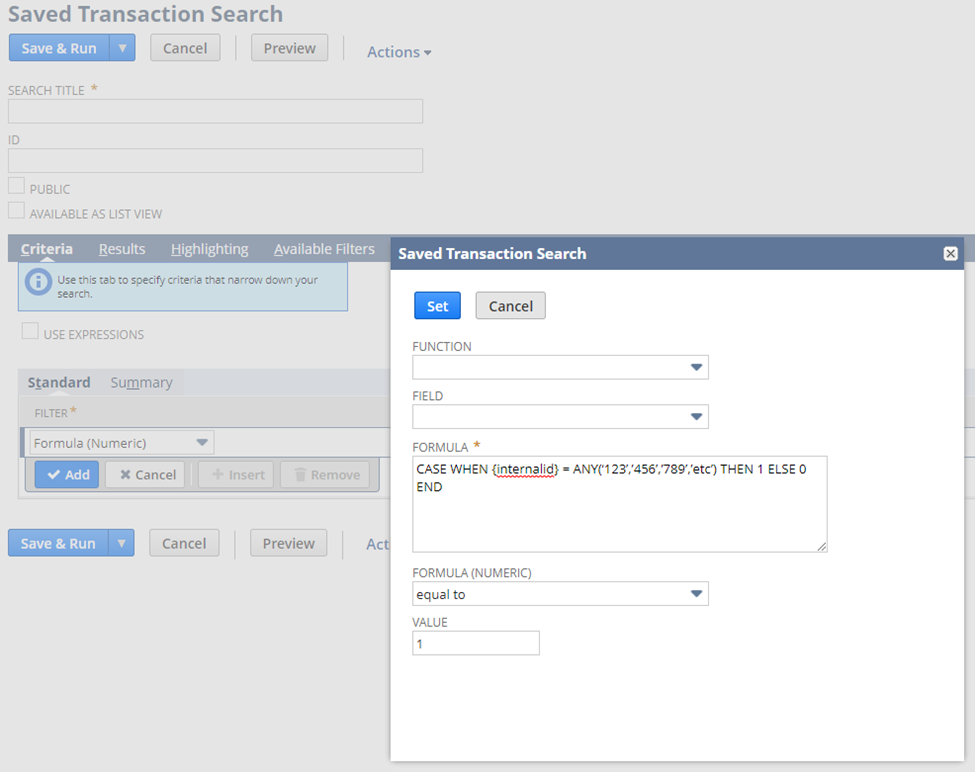
Saved searches don't carry the same hard row limit, though Oracle notes that exporting extremely large result sets can fail. The bigger constraint is logic, because cross-record joins, calculated fields, and custom formatting usually require scripting once you move past the basics. That's where self-service reporting stops being self-service.
Why NetSuite Dashboards And Cross-Module Views Fall Short
NetSuite's reports are largely tied to individual modules, so the GL, AP, and CRM each report on their own data. Connecting financial and operational information, such as revenue by customer segment or project margin by region, usually means exporting to a spreadsheet or another tool and joining it there.
Native dashboards add to the pressure with limited visualization options, which is why so many teams end up running Power BI or Tableau alongside NetSuite just to put a trend line in front of the board.
Learn to automate your accounting for 5.5 free CPE credits. Take the Finance Engineer Course.
Why Do NetSuite Reporting Limitations Get Worse As Companies Scale?
Row limits, module boundaries, and manual pack assembly are each manageable at one entity with modest volume. Adding subsidiaries, transactions, and people asking questions pushes on all of them at once, and that's the point where workarounds start becoming a permanent part of every close.
Why NetSuite Consolidated Reporting Still Takes Manual Work
NetSuite consolidates financial statements natively, which is one of the main reasons companies move to it from QuickBooks. The monthly reporting pack for leadership and the board is where the manual work lives. Coras Consulting, a NetSuite implementation partner, describes the common approach as exporting a trial balance, or a series of them, into Excel and building the P&L and balance sheet views there. It works, and it takes real time to configure and has to be maintained every time new accounts get added.
Consolidated reporting also hits hard gaps in specific views, like NetSuite's refusal to set balance sheet columns to accounting period when the subsidiary context is consolidated, even though it allows exactly that for a single subsidiary. NetSuite tracks it as Enhancement #130536, and it's the kind of gap that pushes a quarterly balance sheet trend straight back into Excel.
The more subsidiaries, currencies, and books involved, the more of the pack gets put together by hand, and intercompany balances that don't tie add an intercompany reconciliation problem on top.
Why NetSuite Reports Slow Down Or Time Out As Data Grows
Complex queries against large data sets slow down or time out, and it tends to happen during close or board prep, exactly when reports are running hardest. Scheduled reports carry a specific version of the problem, since one that runs longer than three minutes during peak hours gets disabled automatically until someone edits it or moves it off-peak.
The usual response to a timeout is to narrow the filters, split one report into several smaller ones, or push the heavy runs to off-hours. Each of those gets the report to finish, while volume keeps growing and the limits stay exactly where they are.
Why New Reporting Dimensions Require Reclassing History In NetSuite
If a dimension or custom field wasn't on a transaction line when it posted, there's no way to report on it afterward without reclassing the history.
Say the company launches a new business unit and leadership wants performance by that unit going back two years. None of the historical journal entries carry the tag, so the choice is between a report that starts on the launch date and a manual remapping project across every affected period. The information you need to answer the question was never captured, and no reporting tool can recover it after the fact.
How Teams Try To Fix NetSuite Reporting Limitations (And Where Those Fixes Stop Working)
Most teams work through the same three fixes, roughly in order. Each one is reasonable, and each treats a structural limit as a tooling gap, which is why they help for a while and then stop scaling.
- SuiteAnalytics Connect. This is NetSuite's own answer to the row limits, and Oracle recommends it directly, giving you database-level access for larger, faster queries. Core SuiteAnalytics comes with NetSuite, while Connect is licensed separately and priced per concurrent connection, so the cost climbs with every analyst who needs a live link. It also queries the same underlying GL, which means it changes how fast you reach the data without changing what data exists.
- A BI layer or data warehouse. Connecting NetSuite to Power BI, Tableau, or Snowflake gets you cuts native reporting won't produce. It also adds another system to maintain and another place for numbers to drift from the ledger, so reconciling the reporting layer back to NetSuite becomes its own recurring task. The data arrives already flattened into journal entries, which means the warehouse inherits every gap the GL has.
- More saved searches and scripting. Building more elaborate searches or SuiteScript customizations can approximate the reporting you need. Each one is a one-off build that has to be maintained and re-threaded through the same structure, so the fix happens one report at a time.
The costs stack up quickly, since NetSuite modules alone run $7,200 to $24,000 or more a year each before you add a BI license, a warehouse, and the people needed to keep all of it in sync with the ledger.
Why NetSuite Reporting Limitations Are Structural
Finance wants flexible, current cuts of the data, and NetSuite's reporting tools sit on a general ledger designed for posting transactions. Asking one structure to do both jobs is what produces row limits, rigid searches, and a monthly pack assembled by hand.
How NetSuite's Journal-Entry-Based GL Shapes What You Can Report On
A transaction becomes a journal entry when it posts, and whatever context didn't make it onto that entry is gone for reporting from then on. Dimensions you tagged at posting survive, operational detail you didn't capture is lost, and the structure is fixed the moment the entry writes.
Because that structure is fixed, native reports, saved searches, and add-ons all eventually meet the same wall. Each of them queries a ledger built to record transactions, so any question it wasn't set up to answer has to be solved somewhere else.
The Same Limit Applies To Any Journal-Entry-Based GL
NetSuite is a strong ERP, and its reporting is more capable than what most mid-market teams used before it. The limitation belongs to the journal-entry model itself, so any system that records a journal entry as its unit of data inherits it, including newer AI-native ERPs that still run on journal entries and a chart of accounts underneath. Sage Intacct's dimension issues come from the same property, and NetSuite is simply the example where teams tend to build the most reporting before they hit it.
See why Built replaced NetSuite with Numeric's Financial Data Platform.

How Numeric's Financial Data Platform Reports On Data Differently
Numeric's ERP replacement, the Financial Data Platform (FDP), is the data platform finance teams run on instead of NetSuite, with more functionality and without the architectural constraints that produce these limits. Under it, the journal entry stops being the unit of data entry, because the FDP keeps the original business event, meaning the invoice, the contract, the vendor bill, as a full object and derives journal entries from it automatically. This is data-centric accounting, and reporting queries that object directly, so row limits, scripting requirements, and module boundaries drop away with no GL-shaped table sitting in between. It's also why a new business unit, product line, or cost center can be reported on without reclassing history, since nothing was fixed at write-time to begin with.
"You cannot solve accounting without solving reporting."
Anthony Alvernaz, cofounder of Numeric, at Numeric's Inflection Summit
That object carries the context a journal entry drops. A contract keeps its customer, terms, products, and pricing, and a vendor bill keeps its vendor and line items. As each event moves through the accounting rules your team defines, it picks up the dimensions finance reports on, like entity, product, region, and customer. Every number in a report comes from those objects, so any cell drills back to the source document behind it.
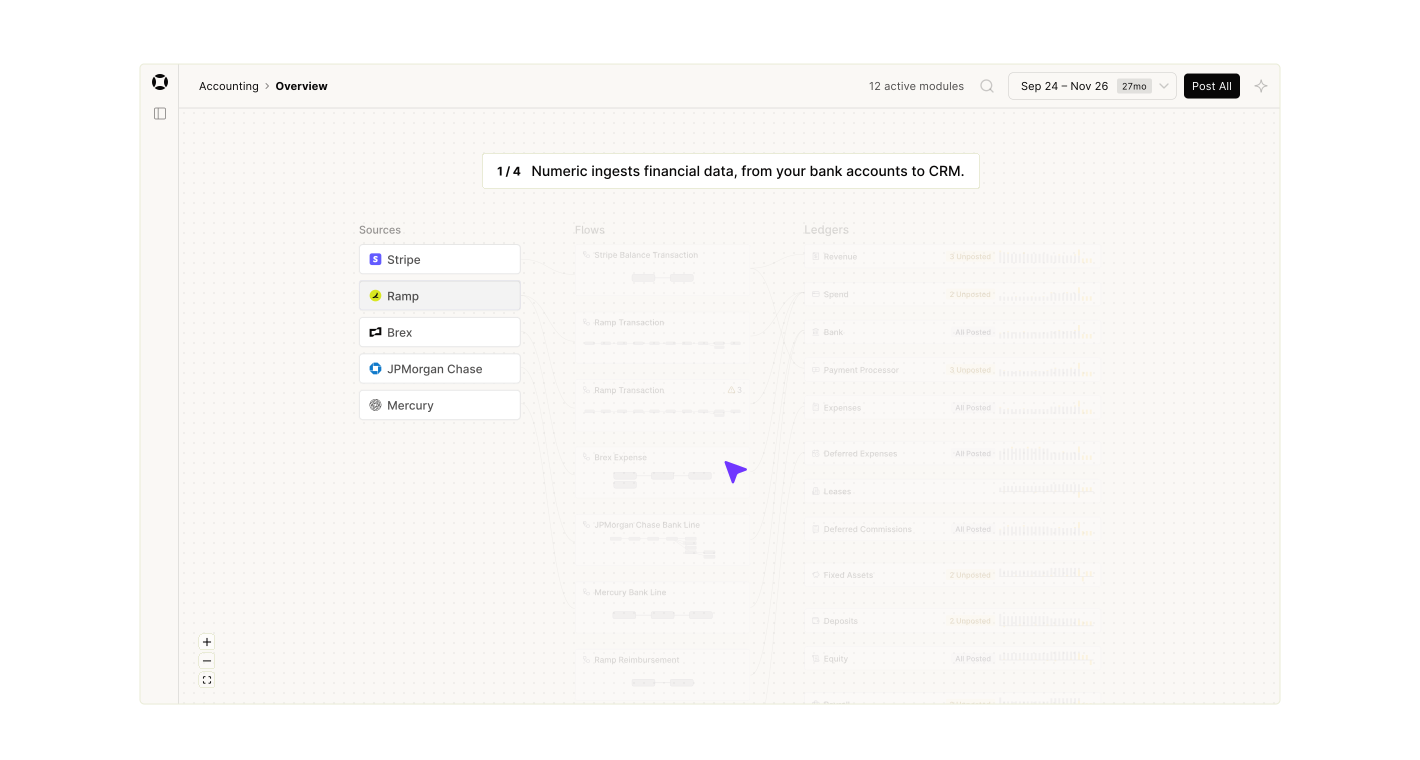
Adopting the FDP doesn't require replacing NetSuite on day one, because teams can start with any of Numeric's modules, whether reporting, cash, or billing and revenue. From there you expand into the full platform on your own timeline, getting relief on the most painful reporting problems while the larger move happens in stages.
| Limitation | Workaround on a journal-entry GL | Financial Data Platform |
|---|---|---|
Report row limits | Narrow filters, split reports, or add SuiteAnalytics Connect | Reporting queries objects directly, with no report table to truncate |
Saved search logic | Script custom joins and calculated fields | Any dimension on the object is reportable without scripting |
Cross-module views | Export to a BI layer or warehouse and join there | Business events carry their full context in one system |
New reporting dimensions | Reclass historical entries by hand | Transactions re-derive around the new structure |
How Far Will A NetSuite BI Layer Actually Get You?
A BI layer or SuiteAnalytics Connect can work well for plenty of teams today, and there's no reason to remove one that's doing its job. It still reads from the same journal-entry structure underneath, though, so a lighter reporting need delays the ceiling without lifting it. Every team on that structure eventually reaches the same wall, and the only real variable is timing.
Signs A BI Layer Is Still Enough For Your Team
Teams with modest reporting demands are making a sound choice with a BI layer today. They simply haven't reached the ceiling yet, and since the ceiling is architectural, better tooling postpones the day they do. You're likely here if:
- Your entity count is still in single digits
- Reporting requests are mostly one-off rather than recurring
- Row limits come up rarely, if at all
- The monthly pack comes together without a dedicated manual process
Signs You've Hit NetSuite's Structural Reporting Ceiling
A structural ceiling shows up as reporting work that recurs every close instead of occasional friction, and you're likely here if:
- The consolidated reporting pack needs a dedicated manual process each month
- Reports regularly time out or truncate at their row limits
- A BI or warehouse stack exists specifically to work around native reporting
- New reporting dimensions require reclassing historical data before anyone can use them
Report on any dimension leadership asks for, including ones you add later. See how in a demo of the Financial Data Platform.
Turn NetSuite Reporting Fixes Into A Structural Decision
Row limits, rigid saved searches, and a hand-built monthly pack all trace to the same place, which is how NetSuite's general ledger stores data. Its reporting tools sit on a ledger designed to record transactions, so every question that ledger wasn't built to answer has to be solved somewhere else.
Object-level data lets finance report on any dimension in real time, without row limits to work around, scripting to maintain, or a BI stack to keep in sync with the ledger.
If your team assembles the board pack in Excel every month or reclasses history each time leadership wants a new cut, the Financial Data Platform is built for exactly that gap.
Book a demo to see what reporting looks like when it runs on the business event instead of the journal entry.
Frequently Asked Questions About NetSuite Reporting Limitations
The biggest NetSuite reporting limitations are row limits on large reports, saved searches that need SQL formulas or scripting for anything past a basic filter, and reports that stay inside a single module. Consolidated statements run natively, while the monthly board pack usually gets assembled in Excel from exported trial balances. These limits grow with entity count and transaction volume because they come from how NetSuite's general ledger stores data.
Oracle documents the ceiling at 100,000 rows for a report run on demand and 1,000,000 rows for one run in the background, such as a scheduled, emailed, or exported report. Results past those limits get cut off. Saved searches don't carry the same hard limit, though exporting very large result sets can fail.
Most teams choose from three kinds of tools. SuiteAnalytics Connect gives database-level access for larger queries and is licensed per concurrent connection. BI tools like Power BI and Tableau, often fed by a data warehouse, handle visualization and cross-module views. Reporting tools like Numeric sync transaction-line detail from NetSuite so you can build pivots without formulas or a NetSuite admin. All three read the same journal entry data underneath, so none of them can report on a dimension that wasn't captured when the entry posted.
Start by narrowing filters and date ranges, running large reports in the background, and scheduling heavy runs outside peak hours. Save customized reports and searches so the team isn't recreating them each period. These steps help reports finish on time. For cuts native reporting can't produce, like revenue by customer segment, teams usually add one of the tools above.
A department, class, location, or custom field has to be on the transaction line when it posts, so older entries don't carry a dimension you add later. Reporting on it historically means reclassing the history first. Teams either start the report on the date the dimension launched or remap every affected period by hand.
Numeric's ERP replacement, the Financial Data Platform (FDP), keeps each business event, such as an invoice, contract, or vendor bill, as a full object and derives the accounting from it. Reporting queries those objects directly, so any dimension on them is reportable without scripting, and transactions re-derive around a new dimension without a reclass. Teams can start with Numeric's reporting on top of NetSuite and expand into the full platform from there.
Related Content
NetSuite Reporting Limitations: Why Native Reports Break Down As You Scale
NetSuite reporting limitations come from how the general ledger stores data. See why row limits and manual board packs happen and what fixes them.
.png)
Sage Intacct Dimension Issues: Why They Break at Scale
Learn why Sage Intacct dimension issues show up as you add entities, what teams try first, and when better governance is still enough.
.png)
Expense Allocation in Accounting: From Shared Costs to True Margins (and Why the Usual Methods Break)
Learn what expense allocation involves, why it's essential for fully loaded P&Ls and true margins, and why spreadsheet models and aggregate JEs keep failing, plus how to fix the root cause.