7 NetSuite Reporting Tools, and When to Just Replace NetSuite

.png)
Most teams go looking for a NetSuite reporting tool after the monthly pack starts taking days to assemble, or after a request for revenue by product and customer cohort turns into a NetSuite export, a billing extract, and a stack of spreadsheet joins.
Seven tools can take work out of that, though they help with different parts of the process. All of them improve how reports get built and delivered, and none of them change what the ledger recorded, which is the other reason those joins exist. Sorting your problem into one of those two buckets is what determines whether a reporting tool fixes it.
This guide compares seven NetSuite reporting tools by use case, then covers a separate option for teams whose reporting problem starts in the accounting foundation itself.
What NetSuite's Built-In Reporting Already Covers
Before you buy anything, check what you already have. NetSuite ships four native reporting tools:
- Report Builder. Everyday financial and operational reports, with control over columns, filters, sorting, and grouping.
- Financial Report Builder. Statement layouts, with row and section control over how a P&L or balance sheet reads.
- Saved searches. Direct record queries returning the transaction-level lists that reports don't produce.
- SuiteAnalytics Workbook. Pivot-style analysis with datasets, multilevel joins, custom formula fields, and charts, covering a lot of what teams assume requires an external BI tool.
NetSuite Reporting Limitations: Why Teams Explore Other Tools
NetSuite's standard reports, saved searches, and Workbook handle most single-entity, single-module questions well.
What sends teams shopping for a reporting tool is the recurring work around them, meaning the board packs assembled in Excel, the cross-entity views rebuilt every close, and the business questions that need data from billing or CRM that the ledger never captured.
Recurring Reporting Still Requires Manual Assembly
Producing a single report in NetSuite is straightforward. Producing a board pack every month is where time disappears, because it means exporting several reports from different modules, pasting them into a workbook, formatting the layout, reconciling the pieces against each other, circulating the result for review, and repeating that sequence next month with updated numbers.
Most of the tools in this guide target the assembly problem specifically. They automate retrieval from NetSuite, give you more control over layout and formatting, and handle distribution so the finished pack doesn't depend on someone emailing a file.
Business Questions Often Need Data NetSuite Doesn't Hold
Questions about customer cohorts, product lines, or unit profitability usually depend on billing, CRM, or usage data that either never entered NetSuite or entered as a summarized journal entry without the links needed to break it apart.
Teams compensate by joining data from multiple systems, building mappings, and maintaining separate models. A reporting tool can help with the first situation, applying a new dimension like product line or region to transaction data NetSuite already holds. It can't help with the second, because when a billing integration posts a single revenue line without the customer, plan, and usage detail behind it, no downstream report can put that detail back.
New Reporting Requests Create Technical Bottlenecks
Adding a field, a calculation, or a new reporting view in NetSuite usually requires an administrator, a consultant, or an engineer. That turns every new question from leadership into a ticket and a wait. A request like "add margin percentage to the monthly revenue report" can sit in a queue for weeks while the CFO assumes it's a five-minute change.
When you evaluate tools, separate what NetSuite cannot do from what it can do but your team can't configure without help. The first is a software limitation a new tool might solve. The second is a permissions and access problem that adding another system won't fix.
NetSuite Reporting Tools At A Glance
The shortlist spans three categories, starting with spreadsheet reporting that keeps Excel or Sheets as the authoring surface. Packaged analytics ships prebuilt models and dashboards instead, while custom BI hands you a full environment to build in. Which category fits depends on where your team already works and how much modeling capacity you have.
As a note: While all of these tools are great, they have limitations. Every tool in the table reports on what NetSuite's ledger already recorded, so a summarized journal entry constrains all seven equally.
Numeric’s Financial Data Platform works differently, replacing NetSuite as the financial system of record and keeps the full source record alongside the accounting, which means product, customer, and contract detail is available to report on instead of reconstructed downstream every month. That's a different decision from picking a reporting tool, so we’ll talk about this later on.
7 NetSuite Reporting Tools To Consider
Below are seven tools that improve how you get reports out of NetSuite, organized from spreadsheet connectors to full BI platforms to Oracle's own warehouse. All seven keep NetSuite as the system of record, and several require a second license or connection service to function, which shows up in each profile's pricing and integration sections.
1. Solution 7 by Zone: Financial Reporting In Excel
Solution 7 is an Excel add-in from Zone & Co, a NetSuite-focused software vendor. It gives finance teams a live connection between Excel and NetSuite, and reports having over 1,500 customers. With this tool, your reports stay in Excel and refresh with a click instead of a copy-paste.
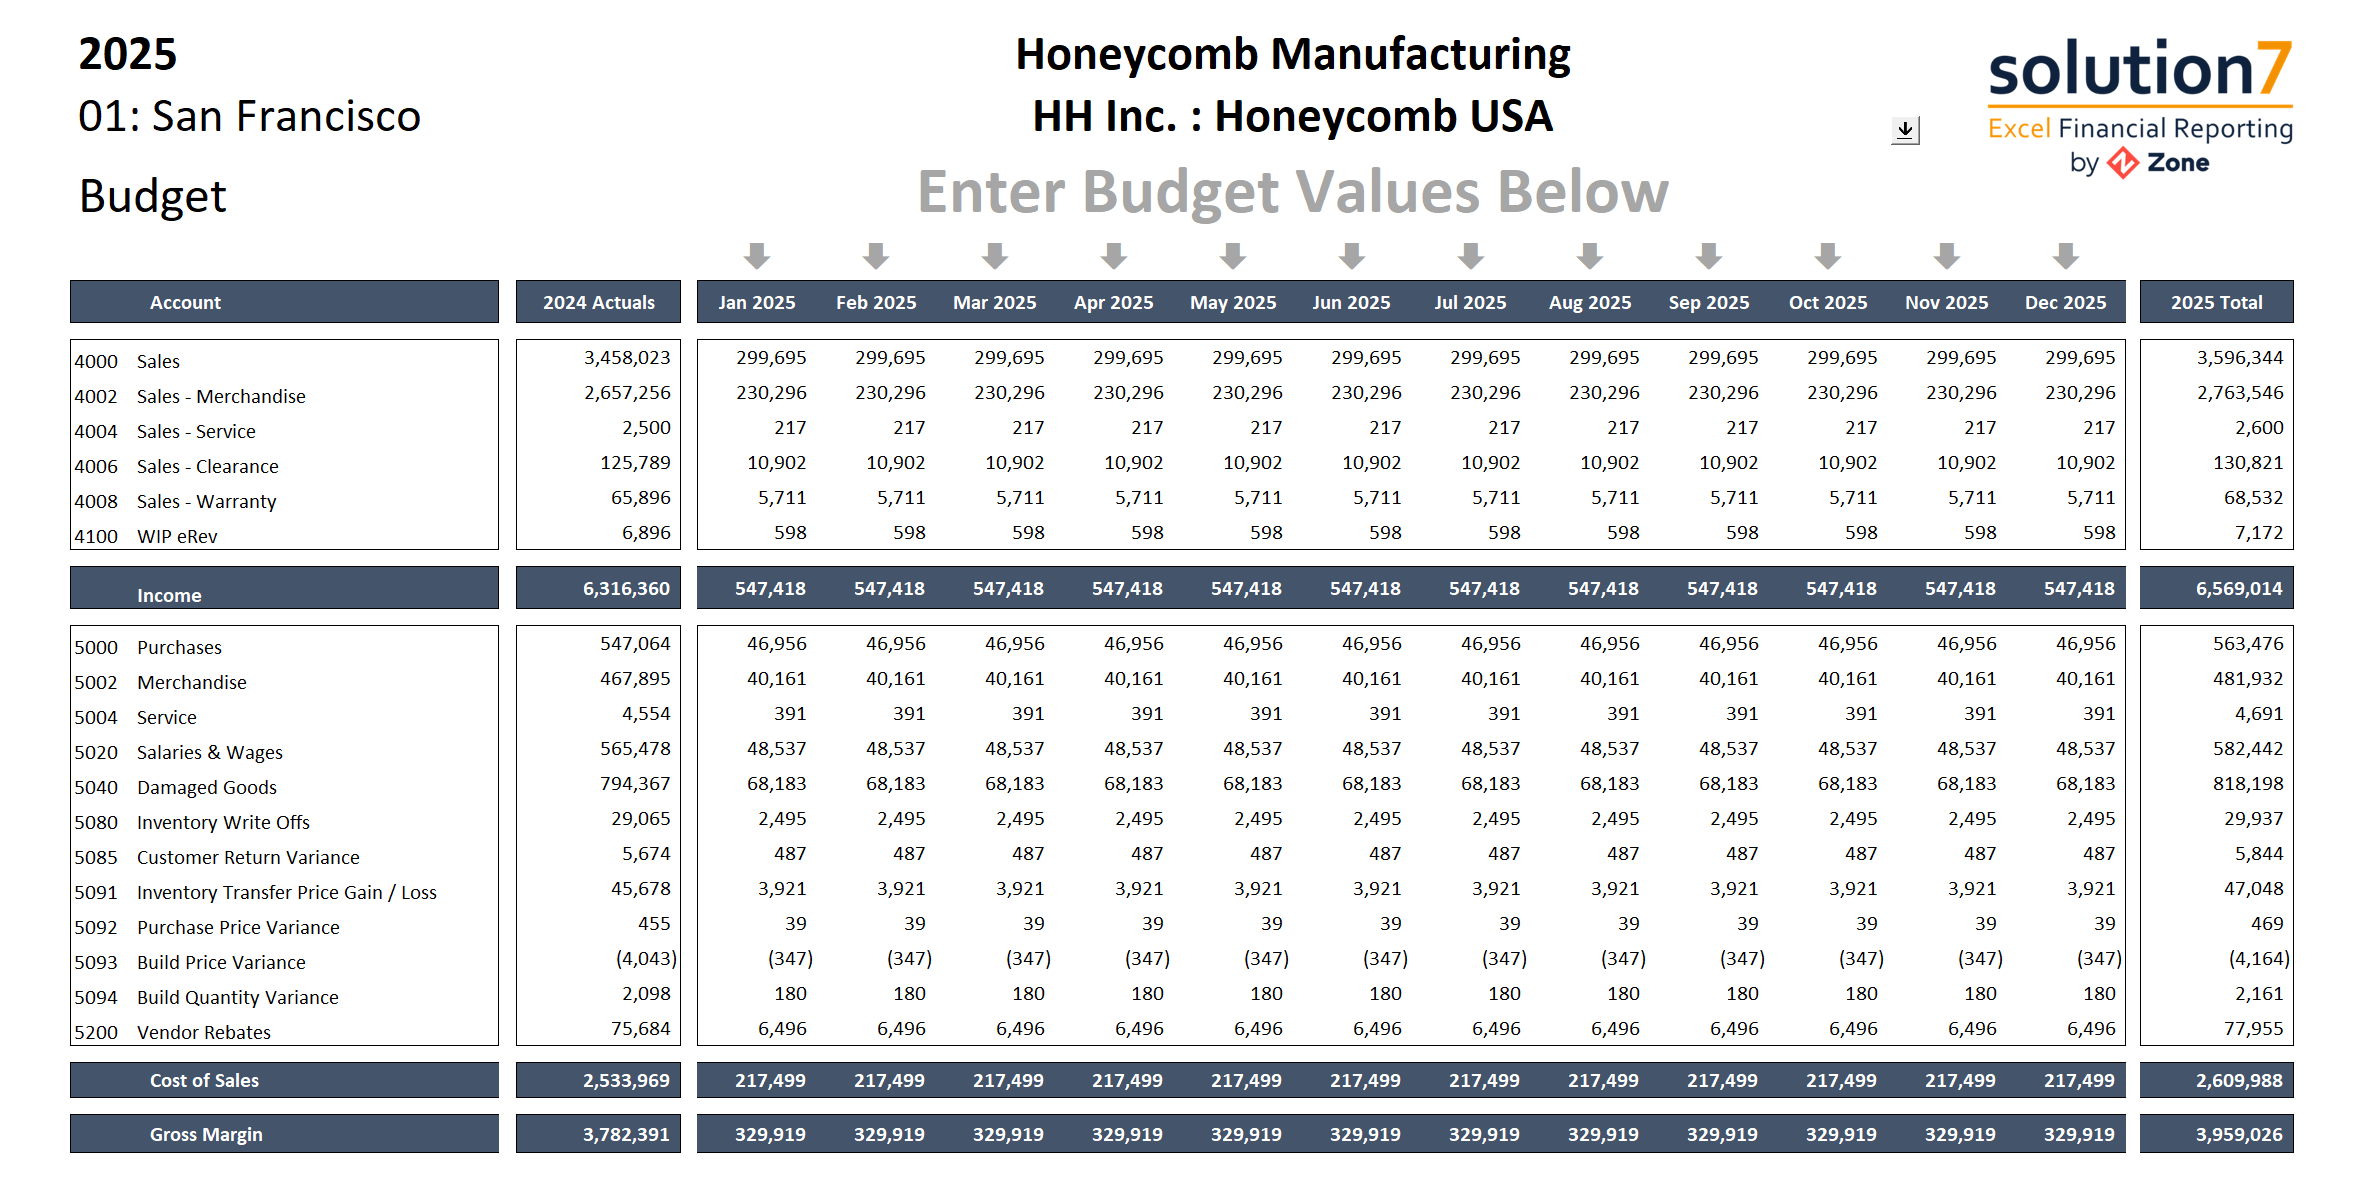
Best for: Finance teams producing recurring management or board packs in Excel who would rather refresh a familiar workbook than rebuild their reporting in a new interface.
Key features and capabilities:
- Point-and-click navigation of the NetSuite data structure inside Excel
- Consolidated P&L, balance sheet, and cash flow reporting
- Multi-entity and multi-currency support
- Drill-down and drill-back to NetSuite
- Pivot tables and charts built with standard Excel functionality
- Bi-directional writeback that pushes Excel budget data into NetSuite
How it integrates: Installs as an Excel plug-in and connects through NetSuite's SuiteAnalytics Connect module, respecting existing NetSuite permissions. Zone says it can be enabled in about an hour.
Strengths:
- Customers frequently cite ease of use when using the platform
- Reviewers consistently praise reliable customer support
- Reporting is more robust than what native NetSuite produces
Weaknesses:
- Getting used to the platform is described as initially challenging, though reviewers note saving templates helps
- Advanced Excel skills are still required to use it effectively
- A Gartner Peer Insights reviewer notes a slight risk of data corruption affecting reporting accuracy
- Zone's own guidance says to skip it if your goal is removing Excel from your reporting stack entirely
Pricing: Not published. Available on request through a demo conversation.
2. Spreadsheet Server: Excel Reporting Across ERP Environments
Spreadsheet Server is insightsoftware's Excel reporting add-in, connecting to more than 140 ERP systems. Its distinguishing feature is breadth. If your entities sit on different ERPs after acquisitions, one reporting layer can cover them.
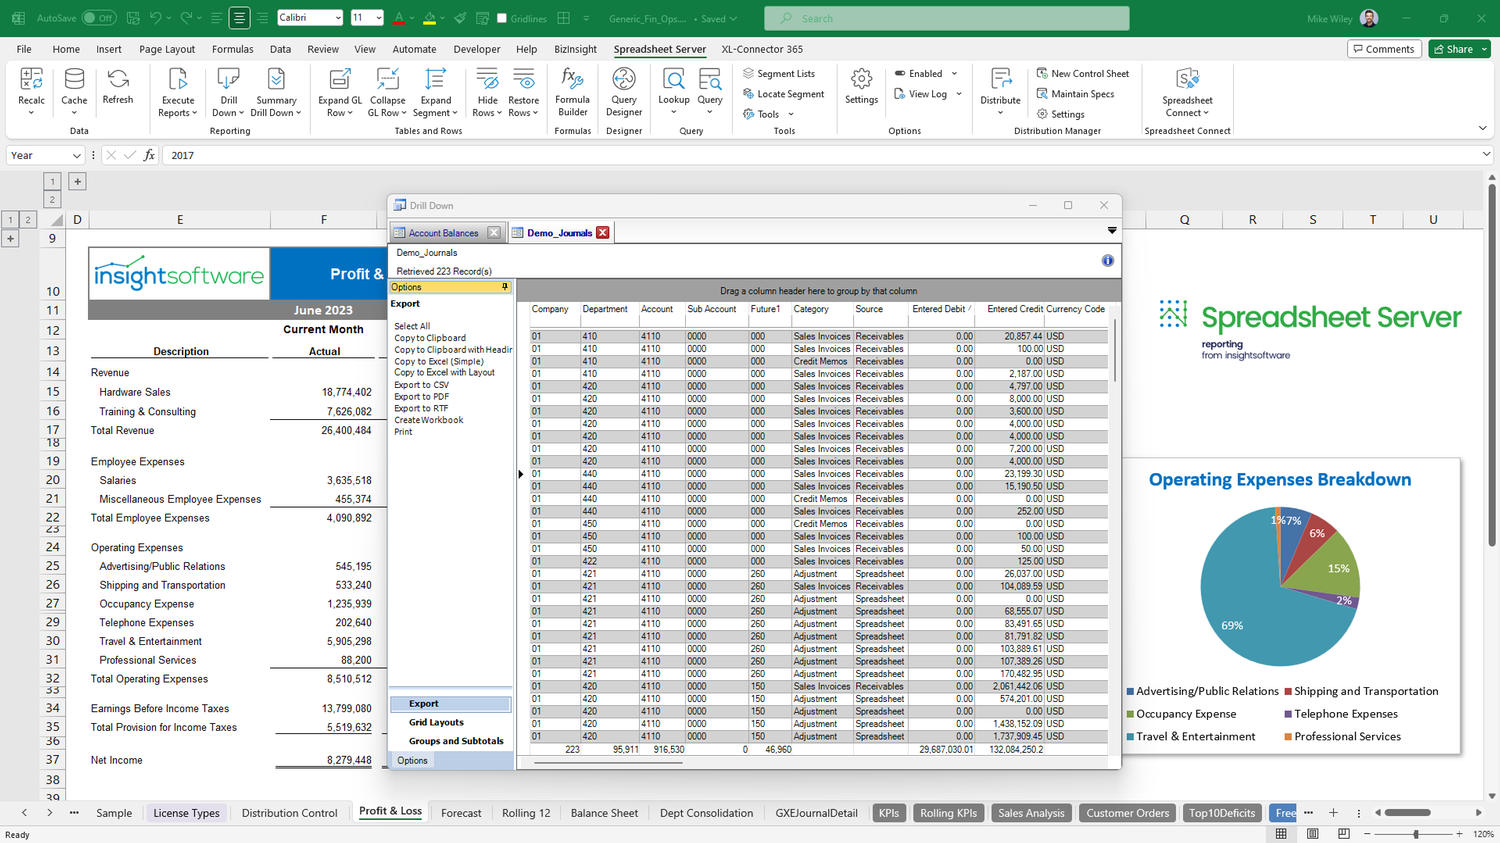
Best for: Finance teams committed to Excel, particularly groups running multiple ERPs where a single reporting approach across entities matters more than depth in any one of them.
Key features and capabilities:
- Live ERP data pulled directly into Excel cells
- Prebuilt financial report templates plus custom report building
- Drill-down from a summary cell to the source transaction
- A metadata-driven approach keeping data definitions and business logic centralized
- Conversion of Excel reports into web reports for wider distribution
How it integrates: A pre-configured Excel add-in connecting directly to the ERP database, eliminating re-keying and repeated downloads.
Strengths:
- Ease of use is the top strength, followed by reporting efficiency
- Multiple reviewers describe report creation as materially faster
- The ability to refresh reports throughout close week comes up as the main practical gain
- Coverage of 140+ ERP systems suits groups running more than one
Weaknesses:
- Performance slows noticeably on large reports, with several reviewers citing slow loading and processing
- Setup is time-consuming
- Reviewers name the NetSuite integration specifically as the difficult one to configure
Pricing: Not published. Quote-based.
3. Coefficient: NetSuite Data In Google Sheets Or Excel
Coefficient is a spreadsheet data connector linking Google Sheets and Excel to more than 70 business systems, including NetSuite, Salesforce, and HubSpot. It targets analysts who want to pull records into a spreadsheet and build their own analysis rather than work inside a reporting application.
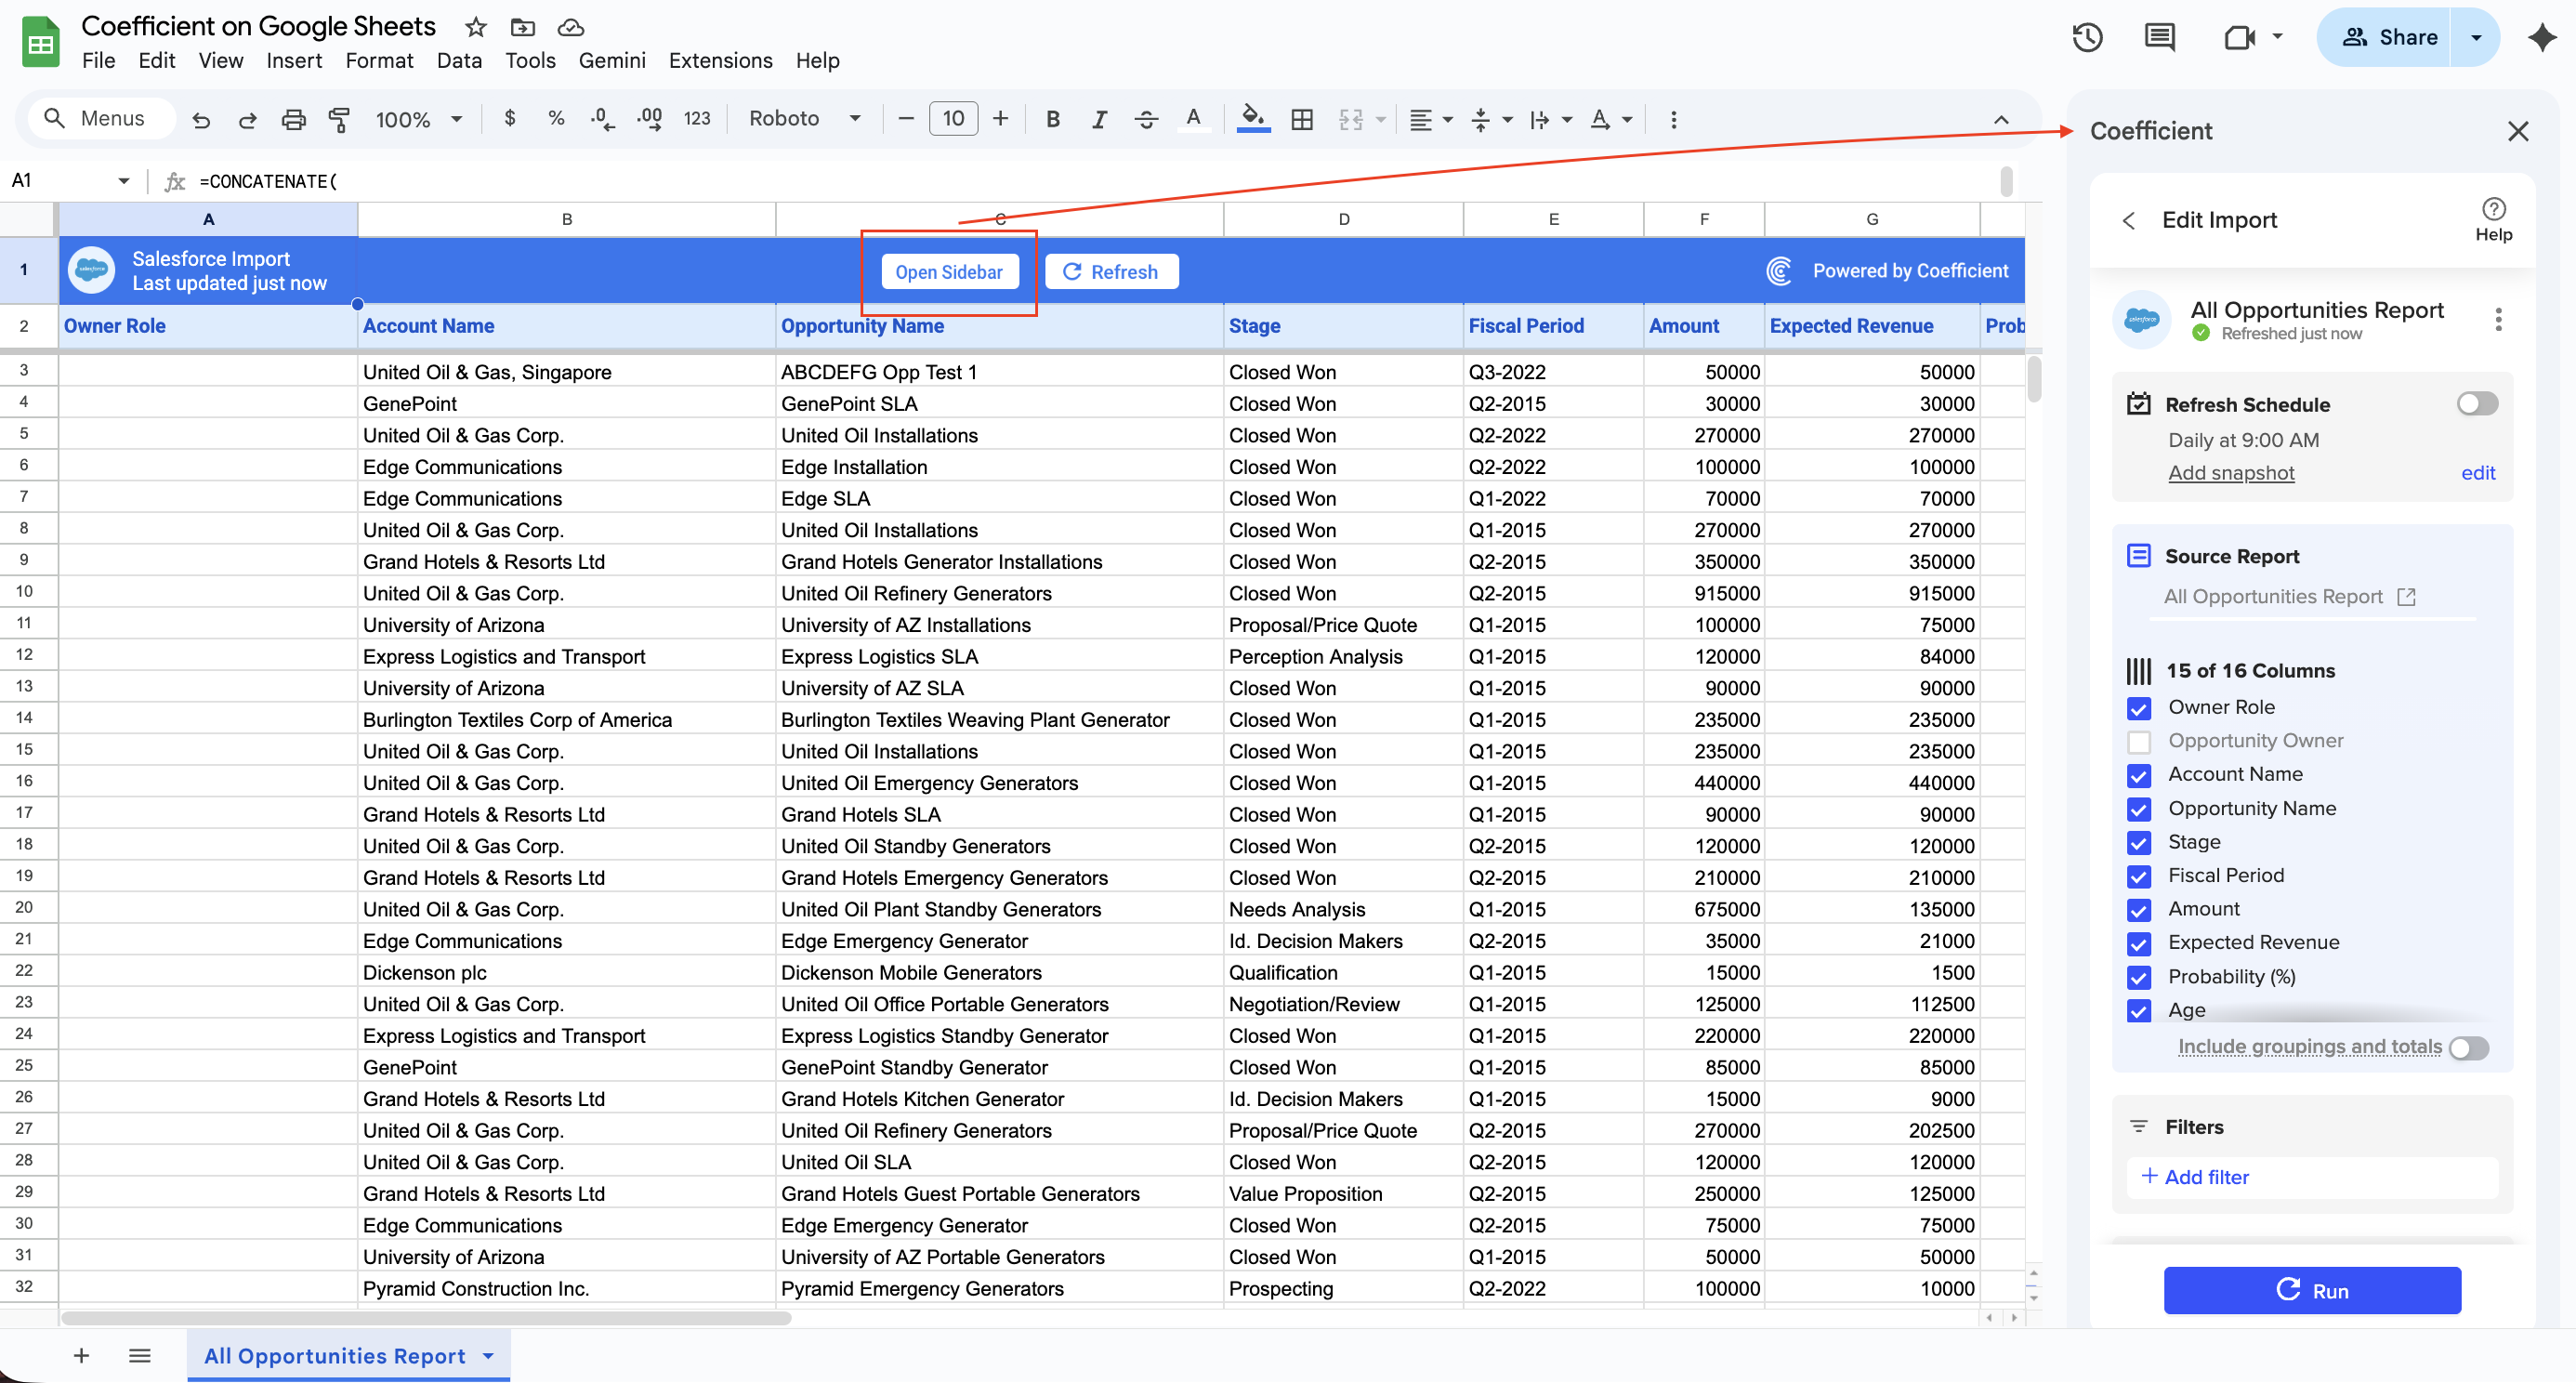
Best for: Analysts who want NetSuite records alongside CRM or operational data in a spreadsheet, and teams working across both Sheets and Excel.
Key features and capabilities:
- Scheduled automatic refreshes across 70+ connected systems
- Two-way sync that pushes spreadsheet updates back to source systems
- Slack and email alerts when underlying data changes
- An AI assistant for formula generation and analysis
- Works in both Google Sheets and Excel, though some features remain Sheets-only
How it integrates: Installs as a Google Sheets add-on or an Excel add-in, connecting over API rather than ODBC, which avoids the driver and infrastructure setup that database-level connections require.
Strengths:
- 170 G2 reviews with strong ratings, the largest review base of any tool here
- Reviewers praise the Google Sheets integration above everything else
- Real-time syncing across multiple sources in one sheet is a recurring theme
- Scheduled refreshes are described as reliable
Weaknesses:
- NetSuite is a premium data source, which means it may require higher-tiered plans
- Performance degrades on large datasets, with row caps on lower tiers
- One G2 reviewer describes the cost limiting to companies with tighter budgets
- It delivers records into a spreadsheet rather than a financial reporting structure
Pricing: Free, Starter at $49 per month, Pro at $99 per user per month, and Enterprise (custom).
4. ZoneReporting: Packaged NetSuite Analytics In Power BI
ZoneReporting is Zone & Co's prebuilt Power BI solution for NetSuite. Rather than building a Power BI environment from scratch, you get a managed NetSuite data model, a custom connector, and report collections designed for finance and operational roles.
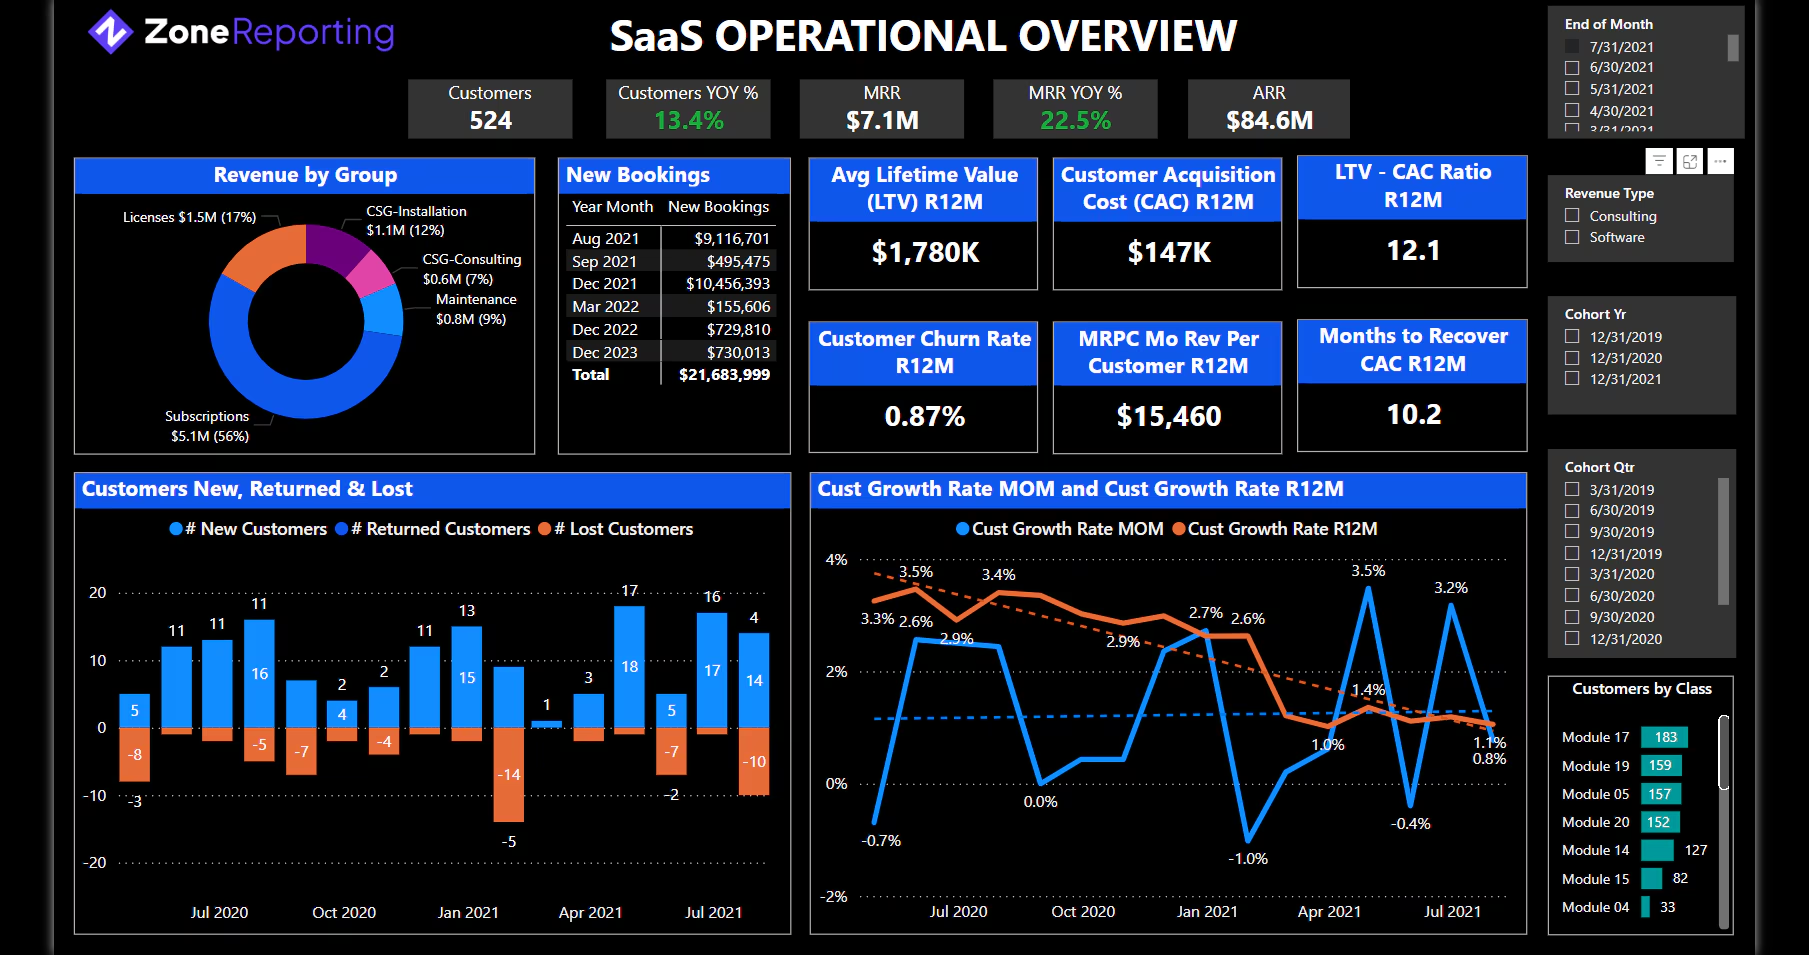
Best for: Teams that want NetSuite-focused Power BI dashboards without building and maintaining the data model themselves.
Key features and capabilities:
- Prebuilt report collections built for CFO, Controller, and analyst roles
- Automatic daily report refreshes
- Drill-down from a dashboard to the underlying NetSuite transaction
- MRR and ARR rollforward reporting
- Power BI dashboards embeddable back into NetSuite portlets
- An optional Data Portal for custom fields and records
- Access to 350+ native Power BI connectors for other sources
How it integrates: A SuiteApp plus a managed data model that feeds Power BI. Reports are available exclusively in Power BI.
Strengths:
- 44 G2 reviews with a 4.4 star rating
- The managed NetSuite data model removes the BI build most teams can't staff
- Usable reports on day one rather than after a modeling project
- Zone Professional Services can own report updates and customizations
- Combining NetSuite with other sources is straightforward inside Power BI
Weaknesses:
- Reports are available exclusively in Power BI, a real constraint if you standardized elsewhere
- Microsoft Power BI license must be bought separately
- Deeper customization beyond the prebuilt reports may need the Data Portal add-on
Pricing: Not published, quote-based, and it sits on top of separate Power BI licensing.
5. Microsoft Power BI: A Custom BI Environment
Power BI is Microsoft's business intelligence platform and the most widely deployed BI tool in mid-market finance, largely because many organizations already own it through Microsoft 365. It gives you a full environment to model, visualize, and distribute reports across finance and every other function.
.png)
Best for: Organizations with internal BI expertise that want flexible analysis spanning finance and operational data.
Key features and capabilities:
- Data modeling with DAX and a large visualization library
- Scheduled refreshes and workspace collaboration
- Report apps, email subscriptions, and mobile access
- Copilot AI features on higher tiers
- Deep integration with the wider Microsoft and Fabric ecosystem
How it integrates: There's no native NetSuite connector, so data reaches Power BI through ODBC via SuiteAnalytics Connect, a third-party connector, or a warehouse in between. Someone has to build the financial data model on arrival.
Strengths:
- Lowest cost per user of the BI options in this comparison
- Deep modeling and visualization capability for teams that can use it
- Often already owned through Microsoft 365, including E5 bundles
- Handles finance and non-finance analysis in one environment
Weaknesses:
- The free tier misleads buyers, since Desktop is free for individual authoring only
- Sharing a published report requires a Pro license for the author and every viewer
- Getting NetSuite data in is a separate project with its own connection cost
- The financial data model is yours to build and maintain
Pricing: Pro is $14 per user per month and Premium Per User is $24, both billed yearly, following Microsoft's April 2025 increase from $10 and $20. Fabric capacity for larger deployments starts around $5,000 per month.
6. Tableau: Visual Analysis In An Existing Tableau Environment
Tableau, now part of Salesforce, is a visual analytics platform known for depth in exploratory analysis and dashboard design. For finance teams, it usually enters the picture because the wider organization already runs it.
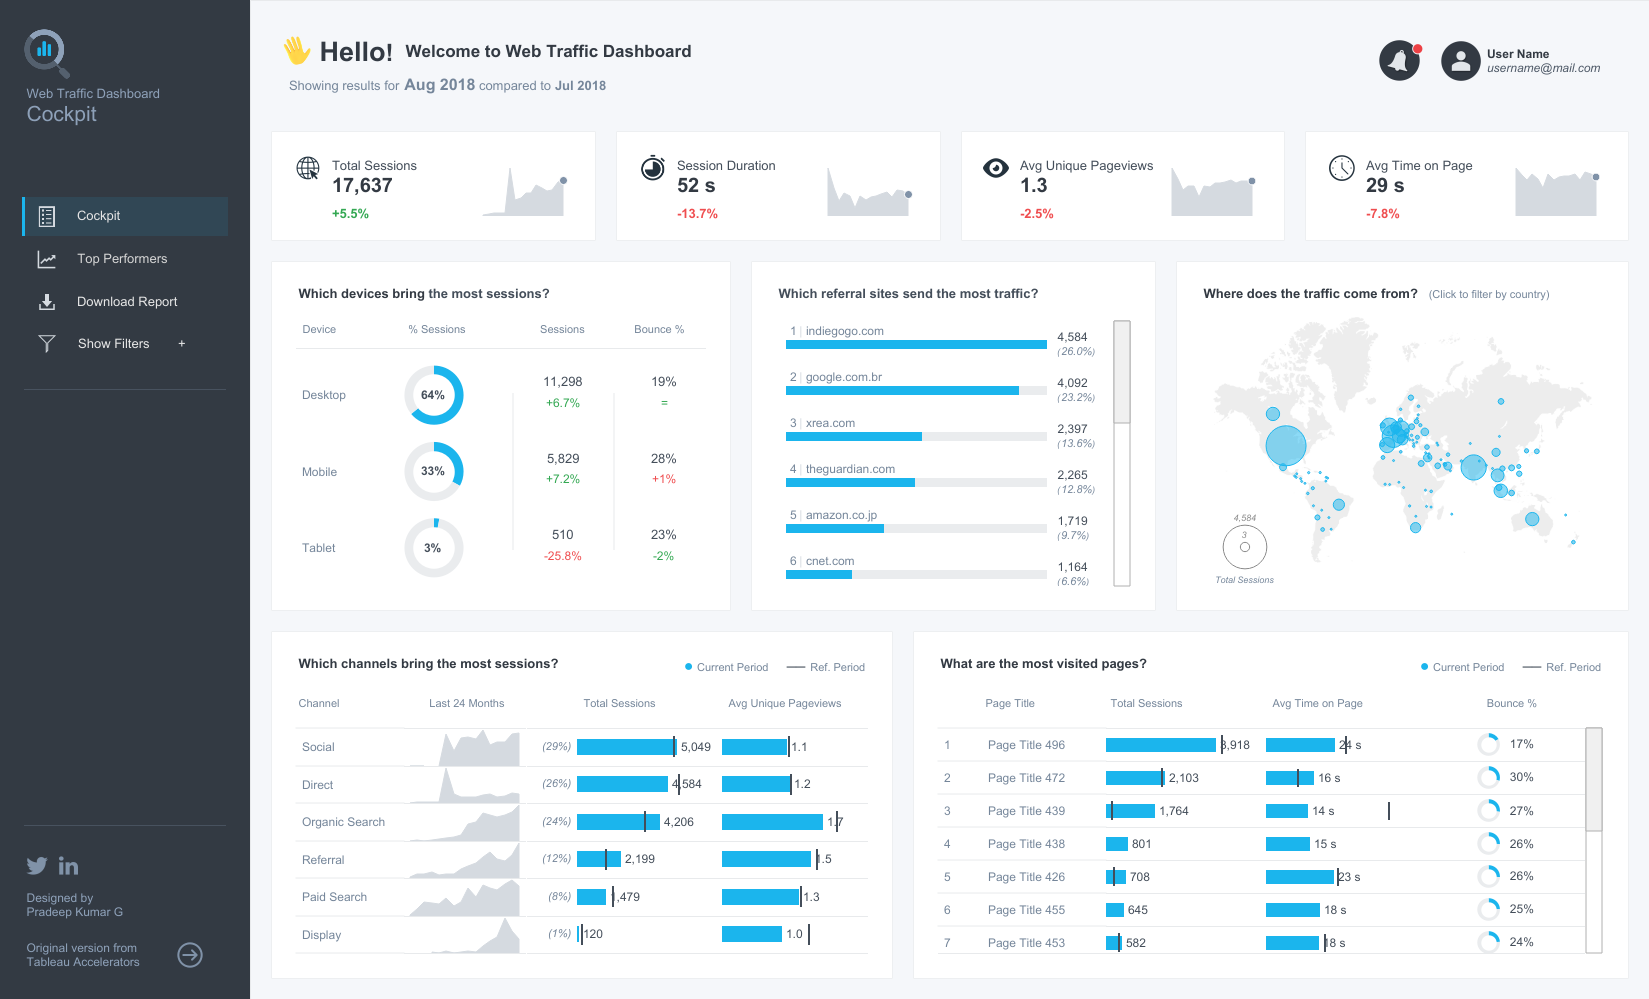
Best for: Teams already standardized on Tableau that want NetSuite data included in broader business analysis.
Key features and capabilities:
- Drag-and-drop visual analysis and exploratory dashboards
- Tableau Prep for data shaping, included with Creator licenses
- Published data sources for governed reuse across teams
- Dashboard sharing across Tableau Cloud or Server
How it integrates: Like Power BI, through an ODBC connection or a warehouse, with the financial data model built by your team.
Strengths:
- Visualization and exploratory analysis remain its strongest suit
- Role-based licensing means viewers cost far less than authors
- Strong fit when the wider organization already runs it
Weaknesses:
- Industry analysis through 2025 and 2026 documents a consistent migration pattern from Tableau to Power BI due to cost
- Like Power BI, it inherits whatever the NetSuite extract contains
- The financial data model is still yours to build
Pricing: Published with Standard starting at $15 per user per month and Enterprise at $35, both billed annually. Higher-tiered plans require a sales conversation.
7. NetSuite Analytics Warehouse: Managed Analytics In Oracle's Ecosystem
NetSuite Analytics Warehouse is Oracle's own prebuilt data warehouse for NetSuite, introduced in 2021. It runs on Oracle Autonomous Data Warehouse with Oracle Analytics Cloud for visualization, and Oracle manages the pipeline from your NetSuite instance.
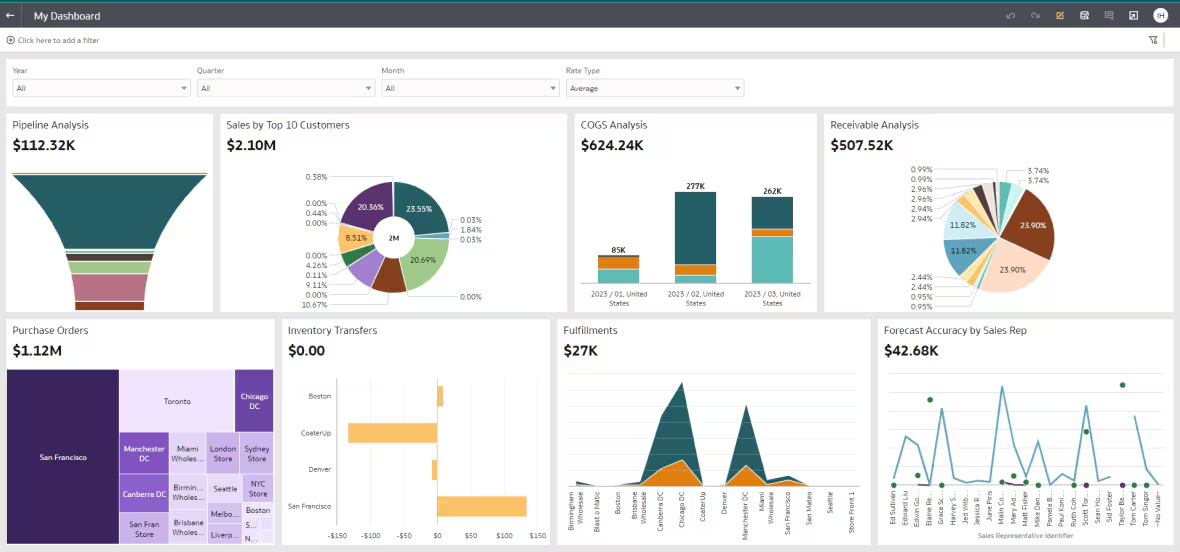
Best for: NetSuite customers who want a managed warehouse with prebuilt pipelines and models rather than assembling their own stack.
Key features and capabilities:
- Prebuilt data pipelines covering 50+ NetSuite subject areas, including order to cash and record to report
- A dimensional star-schema model designed for analytics
- A semantic layer translating data structures into business terms
- Multi-year historical data in one place
- AutoML and Oracle Machine Learning for predictive work
- Ingestion of CSV files and third-party sources such as Salesforce and Shopify
How it integrates: Oracle provisions the tenant and links it to your NetSuite account, with the pipeline managed for you. Refreshes typically run daily.
Strengths:
- No warehouse schema to design, since Oracle has already mapped NetSuite's data
- No pipeline to build or maintain
- Removes the data engineering dependency a Snowflake-plus-BI stack creates
- Cross-source analysis without assembling your own stack
Weaknesses:
- Pricing is opaque, and reviewers describe it as high
- The prebuilt model covers standard NetSuite data well, while custom records and heavily customized configurations may fall outside it
- You work inside Oracle Analytics Cloud rather than the BI tool your team may prefer
Pricing: Not published, and requires NetSuite.
What NetSuite Reporting Tools Solve and Where Ledger Data Gaps Remain
While these tools are all great, there are some limitations that they can’t overcome, as we discussed above. Some are report delivery problems, where every tool in this guide helps. Others are accounting data problems, where none of them reach.
Here's where reporting tools help and where they stop:
- Better access and presentation removes real work. When the data is complete, a pack that took two days of exporting and formatting can refresh on a schedule instead.
- Analysis doesn't fix what the ledger never recorded. If a billing integration posts summarized revenue without the product and customer detail, no downstream dashboard or model puts that detail back without someone maintaining the joins and reconciling them to the books every period.
- A refreshed dashboard is not completed accounting. A successful refresh means the pipeline ran, not that the accrual was posted or the reclass was reviewed.
Numeric FDP: Replace NetSuite At The Reporting Foundation
For teams whose reporting pain starts in the accounting data model, Numeric's Financial Data Platform replaces NetSuite as the financial system of record rather than reporting on top of it.
Here's how it works:
- Source records stay intact. Instead of flattening a business event into a journal entry, the platform retains the source record, applies your accounting policies, and derives the accounting from it. Product, customer, and contract detail survives into every report.
- Accounting and reporting dimensions stay separate. Accounting gets hard-coded rules, period locking, and auditability. FP&A gets flexible dimensions it can slice without touching the statements, which removes the reason most teams end up running two systems.
- Scope covers finance, not the full ERP. The FDP handles the general ledger, subledgers, billing, revenue, cash, close, and reporting. Non-finance workflows like CRM and inventory stay where they are.
- Adoption is staged. The platform deploys module by module and posts back to your existing ERP during the transition. Most teams start on close management, cash, or billing and revenue. Our switching guide covers what this looks like.
.svg)
How Built Technologies Replaced NetSuite With The FDP
Built Technologies, a Nashville fintech connecting more than 340 lenders with 78,000 owners and contractors, moved its accounting off NetSuite onto the FDP in early 2026. Its platform captured detailed customer-level data on every transaction, and the legacy ERP accepted only a few fields, stripping the rest before it reached the ledger. Controller Asia McKnight describes the difference as having “every piece of information we would ever want, instead of just a few tags.”
Here’s what their process looked like before and after adopting the Financial Data Platform:
Built reports freeing roughly two FTEs of bandwidth from billing and revenue work and delivering invoices four business days earlier.
One caveat worth noting here: Because the FDP pulls directly from source systems, Built put real work into organizing its upstream data first, which McKnight treats as the point rather than a cost.
How To Choose Between Another Tool And Replacing NetSuite
Turn the comparison into an assessment of your own workflows. Start with the work you want to eliminate, then price each path honestly.
Diagnose The Recurring Work
List your three hardest recurring reports. For each one, write down the detail required, how current it needs to be, and every preparation step between the ledger and the finished output.
Then sort those steps into three buckets:
- Retrieval and formatting. Exporting, pasting, formatting, distributing. Reliable data delivered awkwardly points toward a reporting tool.
- Integration and modeling. Joining NetSuite to billing, CRM, or usage data that exists somewhere. Broader analysis needs points toward BI or a warehouse.
- Reconstruction and accounting preparation. Rebuilding relationships the ledger didn't keep, then reconciling the result back to the books. Repeated reconstruction, combined with wider ERP friction, makes replacement worth evaluating.
Judge by frequency and business cost rather than arbitrary triggers like spreadsheet count or headcount. Annualize before you decide anything is minor, since a two-day monthly rebuild is roughly five working weeks a year, and that's the number a CFO will respond to.
Assess Implementation And Ongoing Ownership
For any option, establish who owns setup, financial definitions, permissions, refresh schedules, and ongoing maintenance, and whether that sits with finance, IT, or the vendor.
Ask whether you can trace a reported number back to the originating contract or usage record, or only to the accounting entry. Every option here gets you to the entry, and only some get you to the source, which decides whether investigating a variance takes a click or an afternoon.
For replacement specifically, scope the NetSuite workflows and integrations you'd need to keep, including non-finance modules, alongside accounting policies, opening balances, historical data access, and migration validation before anything gets retired.
Compare The Full Cost Of Each Operating Model
Software price is the smallest part of either number.
For an add-on, count retained NetSuite fees, the reporting license, any connection service like SuiteAnalytics Connect, implementation, and the ongoing modeling, maintenance, and reconciliation effort. Several tools in this guide require a second license to function, and four of them are quote-only on top of that.
For replacement, count the FDP subscription, which is priced on transaction volume and implementation complexity, plus migration, source data cleanup, training, parallel operation, and any systems that stay. Offset only what you can actually retire.
Run both over three years using your own quotes and staff effort. Define success as fewer preparation steps, faster answers, and less maintenance rather than an assumed savings percentage.
Picking A NetSuite Reporting Tool Or A New Financial System Of Record
Report-delivery problems and accounting-data problems look similar from the outside, and respond to completely different fixes.
If your numbers are right and getting them out is the burden, one of these seven tools will pay for itself. If your team rebuilds the same relationships every month because the ledger never kept them, better delivery makes the rebuild faster without making it unnecessary.
Numeric's argument is that the second situation calls for changing what stores the data, and the Financial Data Platform is built to do exactly that.
Book a demo to see what your hardest report looks like when the accounting and the business context live in the same place.
Frequently Asked Questions About NetSuite Reporting Tools

Related Content
7 NetSuite Reporting Tools, and When to Just Replace NetSuite
Compare 7 NetSuite reporting tools by use case and cost, and learn when replacing NetSuite solves reporting problems at the source.
.png)
What Is Multidimensional Accounting? Benefits, Examples, and 3 Steps to Set It Up
Learn how multidimensional accounting tags transactions by department, product, and customer, with examples and 3 steps to set it up.
.png)
ERP vs Data Warehouse: Where Should Financial Data Live?
Understand ERP vs data warehouse, where financial detail and accounting authority live, and how Numeric's FDP brings them into one system of record.