What Is Multidimensional Accounting? Benefits, Examples, and 3 Steps to Set It Up

.png)
Leadership asks for last quarter's revenue by customer segment and product line ahead of the board meeting. Finance already has the revenue total, and it ties. The open question is whether the books captured the business context needed to split that total the way leadership wants to see it, or only the accounts and departments the reports were originally built around.
Multidimensional accounting is how finance teams capture that context in a structured way. Each transaction keeps its account and also carries business attributes like department, product, customer, or region, so finance can report the same activity from several angles without entering it twice.
Tags cover a lot of that reporting. They run out when a question needs detail the ledger never kept, like each customer's start date. Numeric's ERP replacement, the Financial Data Platform (FDP), extends the idea by keeping source records connected to the accounting itself.
Key Takeaways
- Multidimensional accounting attaches business attributes (department, product, customer, project, location, entity) to financial transactions so one set of books supports many reporting views.
- Dimensions describe the context of a transaction. The natural account still describes what happened financially, and double-entry accounting stays intact.
- Separating attributes from the chart of accounts keeps the account list short and makes a new region or product a new value instead of dozens of new accounts.
- Tags answer the questions the underlying data supports. A new dimension on historical data works when the relevant facts were retained and linked.
- Numeric's FDP keeps contracts and invoices from your source systems connected to the books in a financial graph, so finance can report on any grouping those records support and trace a number back to the activity behind it.
What Is Multidimensional Accounting (Dimensional Accounting)?
Multidimensional accounting is the practice of recording financial transactions with multiple business attributes so the same accounting data can be analyzed from different perspectives. A single software invoice can be reported as software expense, as Engineering spend, as a cost of a specific product, and as part of a specific entity's results, all from one entry.
“Dimensional accounting” and “multidimensional accounting” mean the same thing in most accounting software discussions. You'll also see “accounting dimensions” used for the attributes themselves.
Multidimensional reporting is what finance does with those tags afterward. When the team codes a transaction, they decide which attributes to capture and at what level. At month-end, they group and filter by those attributes to build the department P&L or the product revenue view. Neither replaces the ledger. Accounts and double-entry accounting still do their job, and dimensions add the business context around them.
Most teams start with a handful of common dimensions.
How Multidimensional Accounting Works: Accounts, Dimensions, and Values
Every transaction starts with a natural account. Dimensions are the additional attributes attached to the activity, and together they let one entry show up correctly in several different reports.
Accounts vs. Accounting Dimensions: What Each One Records
An account identifies the financial category, like software expense or service revenue. Dimensions describe the business context: who spent it, what it was for, and which part of the business it belongs to. A dimension is the category of context (Department), and a value is the specific entry within it (Engineering).
Many older setups embed that context directly in the account code. A code like 6100-20-03 might mean Software Expense, Engineering, West region. It works until the business changes.
Opening a Central region means creating a new version of every expense account that region will touch, and the chart of accounts grows with every combination.
With dimensions, the natural account stays as 6100 Software Expense. Department and Region are separate fields, and opening a Central region means adding one new value to the Region dimension. Every existing account can use it right away.
Segmented account structures and dimensions can coexist, and many companies run both.
Assigning Dimension Values: Line-Level Tags, Rules, and Allocations
Dimensions can sit at the header of a transaction or on each line. A $12,000 software bill that covers $8,000 of Engineering licenses and $4,000 of Sales licenses needs Department at the line level. Tagging it at the header would force the whole bill into one department and misstate both.
Dimension values come from a few places. Some arrive on the source record, like the customer and region on an invoice synced from a CRM. Others come from defaults (a vendor's usual department), from rules (anything posted to a specific cost center maps to G&A), or from a person reviewing and assigning the value.
Once values are in place, finance can produce a department P&L or a product revenue view straight from the books.
Tagging and allocation are separate steps. Labeling a shared cost like office rent as “Shared” doesn't decide how much of it belongs to each department. That still needs a defensible basis, like headcount or square footage, which is the work covered in expense allocation.
Combining dimensions should never duplicate amounts either. A $10,000 invoice line tagged Analytics add-on and US West appears once in the product view and once in the region view, and both views still total to the same revenue.
Benefits of Dimensional Accounting for Finance Teams
The case for dimensions comes down to the reporting work finance already does every month, and how much of it can come straight from the books instead of a spreadsheet.
A Shorter, Easier-to-Maintain Chart of Accounts
Separating business attributes from financial categories keeps the account list focused on what accounts are for. Coding gets easier because each field answers one question, and new departments, products, or entities become new values instead of new accounts. The chart of accounts stays readable as the company grows.
Management Reporting by Product, Department, or Project
A 40% company-wide gross margin can hide a services line at 15% and a software line at 70%. Financial analytics by product or department shows where the margin comes from. Profitability analysis also needs the relevant costs and allocation logic in place. More revenue tags on their own give you a revenue breakdown, and product profitability comes from pairing them with costs analyzed at a compatible level.
Shared Definitions for Accounting and FP&A
When accounting and FP&A use the same dimension definitions, they can compare actuals, budgets, and prior periods on the same terms. If both teams mean the same cost centers by “Sales,” a budget-vs-actuals report lines up without a mapping tab in between. If they define Region differently, the report still runs, and the variances stop meaning much.
When a Company Needs Dimensional Accounting
Most teams adopt or expand dimensional accounting when the same signals keep showing up: repeated requests for segment views, spreadsheets that recode the same exports every month, new products or entities on the way, and an account structure that gets harder to maintain each quarter. The trigger is reporting complexity, meaning how many different ways the business needs to see its results.
New ownership is another common trigger. Arij Abdullah, who spent years in tax due diligence on M&A transactions at Deloitte, describes what changes once a deal closes:
“Post-acquisition, when new team members are brought in, business priorities change. You have a new CFO, who's maybe come from a public company, and your reporting pressure gets a lot heavier because there's a different standard you need to meet.”
Most of the time that new standard shows up as requests for new cuts of the same numbers, like results by segment or by customer cohort.
Multidimensional Accounting Example: One Revenue Total, Three Reporting Views
Here's a simple set of illustrative revenue records. All four amounts are revenue recognized in the same quarter, Q3.
Total Q3 revenue is $100,000. Viewed by product, the core platform brought in $65,000 and the analytics add-on brought in $35,000. By region, West brought in $55,000 and East brought in $45,000.
A month later, leadership asks for Q3 revenue by customer cohort, grouped by the year each customer started. Because the records kept a customer identifier and each customer's original start date, finance can answer it directly: $40,000 from the 2023 cohort, $15,000 from 2024, $25,000 from 2025, and $20,000 from 2026.
Now picture the same quarter posted as a single $100,000 summary entry to revenue, tagged with product and region totals and no customer detail. The product and region views still work, but finance can't answer the cohort question from that entry alone, because the customer relationships and start dates never made it into the ledger.
Presenting revenue by cohort changes nothing about the accounting. The same $100,000 of Q3 revenue is grouped a different way.
Limitations of Dimensional Accounting in a Traditional GL
Dimension tags are useful, and most modern accounting systems support them well. How far they stretch depends on what sits behind each tag, like the customer ID, the contract, or the start date.
Adding a New Dimension to Historical Data
Three situations can look alike from the outside and involve different amounts of work.
Correcting an existing value, like moving a transaction from Sales to Marketing, is a reclassification. Backfilling a new dimension from data the system already holds, like adding Customer Segment to past invoices that already carry a customer ID, takes some mapping but stays inside the system. Answering a question whose required facts were never captured is the hard case. Someone has to find the data in another system, clean it up, and connect it back to the ledger before the analysis can start.
Most accounting platforms support reclassification, and many support backfills from data they already hold. The deeper limitation shows up when the ledger lacks the source detail or identifiers a new question depends on. In the cohort example, creating a Cohort field in the GL doesn't supply the missing historical start dates. Retaining the relevant facts is what makes future analysis possible, and a tag can only point at facts that are already there.
Drill-Down vs. Tracing a Number to Its Source
“Where did this number come from?” has at least three levels of answer. Reaching the journal line tells you which entry posted it. Opening the associated transaction or document tells you what was recorded. Following it back to the contract or usage behind it, and how it was booked, tells you why the number is what it is.
A summarized revenue posting can reconcile perfectly to the ledger while staying disconnected from the individual contracts, invoice lines, or usage events behind it. The report ties out, and it still offers limited explanation of the business activity underneath. That traceability, often called data lineage, is what auditors and Controllers need when they defend a balance.
Platforms like Sage Intacct already offer transaction drill-down and supporting document attachments. The meaningful comparison across systems is how complete the connected detail is and how far the trace goes.
Keeping Dimension Data Consistent Across Teams
Flexible reports still depend on consistent inputs. When the same customer appears under two IDs, when Region means sales territory to one team and ship-to location to another, or when a third of transactions have the Product field blank, a report with more dimensions can multiply ambiguity instead of reducing it.
A reporting layer or finance data warehouse can make existing context easier to reach. When that context lives outside the accounting system, though, someone still has to join it back to the ledger and reconcile the result every period. The fix is clear data governance, with an owner and a definition for each dimension and its source. Adding more fields doesn't do that work on its own.
How to Set Up Dimensional Accounting in 3 Steps
Three decisions shape whether a dimensional setup still works two years from now: which questions it answers, where each value comes from, and how history is kept. They apply whether you're configuring new fields in your current system or evaluating a new platform.
Step 1: Choose Dimensions Based on the Questions Leadership Asks
Work backward from a short list of recurring questions, like which products drive revenue growth or which departments exceed budget. For each one, identify the dimensions and the level of detail needed to answer it.
Start with a focused set of dimensions, each with a clear definition and an owner. Keep legal entities separate from management groupings, since entities carry statutory reporting requirements that a sales territory doesn't. Treat a new dimension and a new value within an existing dimension as different decisions. Adding “Central” to Region is routine, while adding a whole Sales Channel dimension deserves a conversation about where the data comes from.
Include the questions finance can't answer today alongside the reports it already produces. That list shows whether the fix sits in configuration or in the data and accounting foundation underneath it.
Step 2: Connect Each Dimension to a Reliable Source
For each attribute, identify where it originates and how it connects to the financial record. Stable identifiers for customers, employees, products, and transactions are what make those connections hold up over time, especially as systems change.
Decide how defaults, validation, and missing values work, and who resolves exceptions. Rules and AI suggestions can reduce the manual assignment work. Finance still validates the classifications and maintains what each dimension means.
Check that revenue and costs can be analyzed at compatible levels. If revenue is tagged by product and costs only by department, product profitability will need an allocation step. For shared costs, set the allocation basis and keep a record of how each amount was distributed.
Step 3: Preserve History and Test Reports Against the Books
“As originally reported” and “recast under today's structure” are both legitimate views, and they answer different questions. When a department reorganizes or customer segments are redefined, keep the original classifications or effective dates so the team can produce either view on request.
Before relying on a new dimensional report, check a representative version against the accounting totals using the same period, entity, and currency basis. Include a case with a missing dimension value to see how it's handled, and trace one selected amount back to its supporting records.
Then test the harder scenario. Pick a dimension nobody has asked for yet and walk through how it would work on last year's data, and who would maintain it. The practical measure of a dimensional setup is how much work it takes to answer a new business question.

How Numeric's FDP Supports Multidimensional Reporting From Source Data
Numeric's ERP replacement, the Financial Data Platform (FDP), is a financial system of record that keeps business context alongside the accounting. Numeric calls this data-centric accounting. It's built for two requests that come up every quarter: answering a question nobody planned for when the reports were built, and explaining where a number came from.
Report on New Dimensions With the Financial Graph
In a traditional ledger, each transaction gets posted as a journal entry with an amount, an account, and whatever tags someone picked at the time. The FDP starts one step earlier, with the records in your source systems. It organizes them into a financial graph: long-lived objects like contracts, invoices, and leases, the relationships among them, and the business events that happen to them, like a renewal or a credit memo.
The trial balance is one report the system produces downstream of the financial graph. Debits still equal credits, and the books tie out the way your team expects.
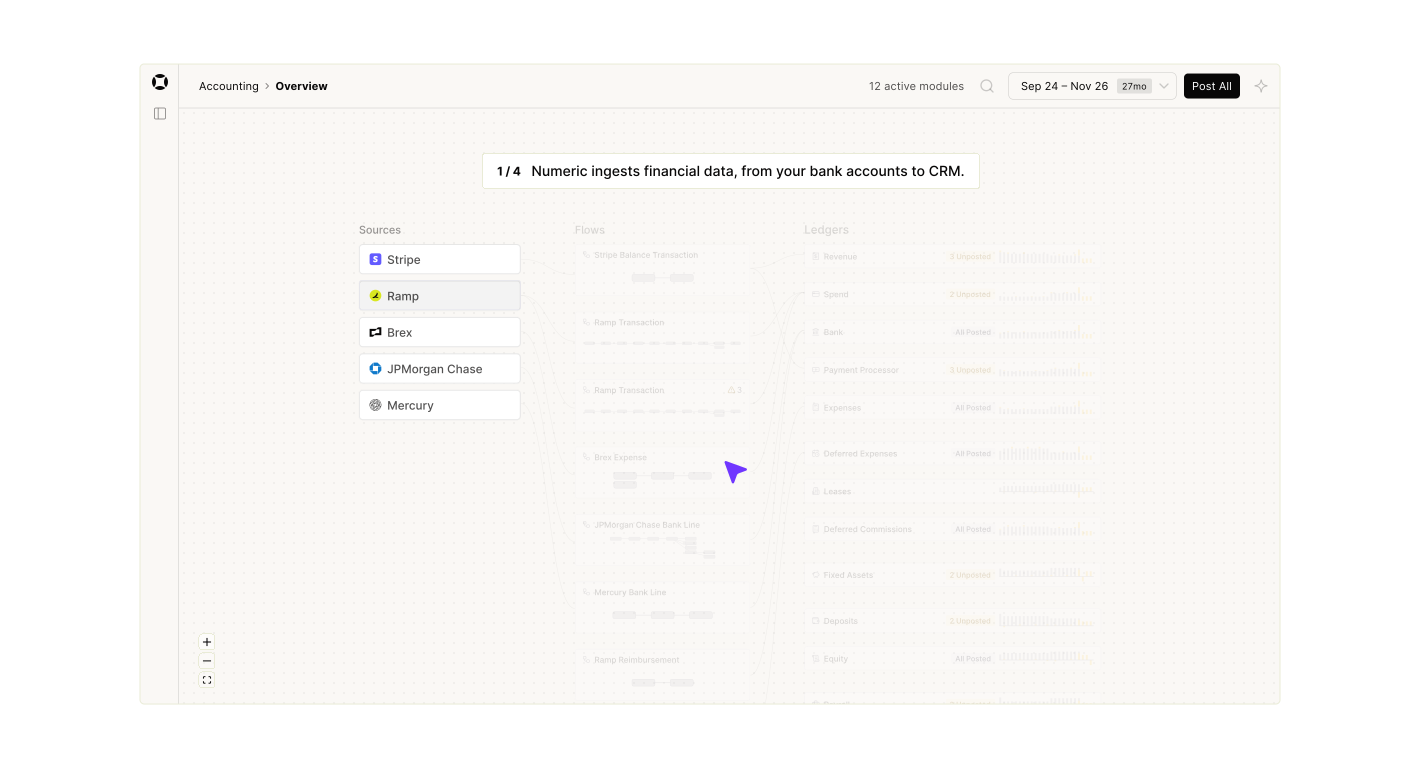
Since those records stay connected to the books, finance can group results by anything those records carry, including groupings nobody asked for when the report was first built. In the cohort example, each customer's ID and start date would already sit on their contract, so Q3 revenue by cohort becomes a new view of data the team already has.
A new view is as complete as the records behind it. When the CRM or billing system captured the detail, the FDP keeps it connected to the accounting so it's ready when someone asks.
Built, a construction and real estate FinTech company, runs on the FDP this way. After moving to Numeric, Built:
- Connected its source systems directly and kept its platform data alongside the accounting
- Gained visibility across business units, customers, and cohorts
- Now works from live daily data instead of month-end estimates
- Can trace billings, revenue, and expenses back to the transaction
“We're almost operating in a different century, it feels like, from a data perspective,” said Controller Asia McKnight.
Trace Every Report Back to Its Source Records
The FDP connects reporting to the source records and the accounting that comes out of them, so every number drills back to its source. From a management view, like revenue by business unit, a Controller or FP&A lead can follow a number down to the transactions that make it up. When the CFO asks why West revenue jumped in Q3, the Controller can open the contracts and invoices behind the number instead of requesting an export.
.png)
Numeric co-founder Anthony Alvernaz explained the thinking behind this design at Numeric's Inflection event: “You cannot solve accounting without solving reporting.”
The FDP is the accounting system itself, so management reports and the books pull from the same source records, and the numbers in a management report already tie to the ledger.
Choosing a Setup That Keeps Up With New Questions
The question worth asking of any setup is whether the system keeps enough connected detail to answer tomorrow's questions and explain today's numbers. When that detail is retained and reliable, new dimensions become new views of data finance already trusts.
Multidimensional Accounting FAQs
Related Content
What Is Multidimensional Accounting? Benefits, Examples, and 3 Steps to Set It Up
Learn how multidimensional accounting tags transactions by department, product, and customer, with examples and 3 steps to set it up.
.png)
ERP vs Data Warehouse: Where Should Financial Data Live?
Understand ERP vs data warehouse, where financial detail and accounting authority live, and how Numeric's FDP brings them into one system of record.
.png)
NetSuite Reporting Limitations: Why Native Reports Break Down As You Scale
NetSuite reporting limitations come from how the general ledger stores data. See why row limits and manual board packs happen and what fixes them.