Cash Flow Analysis For Controllers: Steps, Metrics, And Automation

.png)
The books are closed. Net income beat budget by 5%, and the board deck tells a clean story. Then the CFO calls with the one question that stops the celebration: "Why is the operating account so low if we just had our best quarter?"
The P&L said profitable. The bank account says tight. That gap between reported earnings and actual cash position is where cash flow analysis earns its keep — and where Controllers either build credibility or lose it. Building it requires a repeatable process, the right metrics, and visibility that doesn't depend on a spreadsheet marathon. This guide covers all three.
What Is Cash Flow Analysis and Why It Matters
Cash flow analysis is the process of tracking, categorizing, and interpreting how cash moves in and out of the business across operating, investing, and financing activities over a defined period. It encompasses both the construction of the Statement of Cash Flows under GAAP and the interpretive work of identifying trends, isolating drivers, and flagging risks.
This is distinct from liquidity analysis, which focuses narrowly on short-term cash runway, and from profitability analysis, which lives on the P&L and often obscures cash timing entirely.
A SaaS company can show strong GAAP revenue while hemorrhaging cash through long collection cycles and front-loaded infrastructure costs. Cash flow analysis is where that disconnect becomes visible.
Direct Versus Indirect Method: What Controllers Actually Use
The direct method reports cash receipts and payments by category — collections from customers, payments to vendors, payroll, taxes. The indirect method starts from net income and adjusts for non-cash items (depreciation, stock-based compensation) and working capital changes (movements in AR, AP, inventory, prepaids, accruals).
Most mid-market and enterprise finance teams produce the indirect method for GAAP financial statements. It maps naturally to the balance sheet and P&L you already produce.
However, many Controllers maintain direct-method-style internal reports for day-to-day cash management, since they show actual cash flows in language that operations teams understand. Both methods reconcile to the same net change in cash; the choice is about audience and purpose.
Operating cash flow is typically the primary focus for ongoing health because it reflects the cash-generating capacity of the core business. Investing and financing flows explain strategic decisions: acquisitions, CapEx programs, debt raises, equity issuances.
Consistent classification across periods, particularly where interest payments and dividends land, is critical for comparability.
The New Mandate for Cash Flow Analysis
Cash flow analysis is no longer a quarterly compliance exercise you hand off and forget. Rising interest rates, tighter credit markets, and increased investor scrutiny have made cash visibility a standing agenda item.
Controllers who once focused primarily on producing the Statement of Cash Flows for the audit are now expected to deliver continuous insight into liquidity, runway, and working capital health.
The shift is meaningful. Traditional backward-looking cash flow statements told you where cash went last quarter. Today, CFOs and boards want rolling 13-week forecasts, real-time bank balance visibility across entities, and scenario analysis that answers specific questions like, "What happens to our runway if revenue slips 15% for two consecutive quarters?"
Controllers are uniquely positioned to own this. You sit at the intersection of every transaction, every account reconciliation, and every journal entry. But that position only translates into credible cash insight if the underlying processes—reconciliations, subledger tie-outs, GL mappings — are reliable and repeatable.
As Adam Heeger at Numeric puts it:
"If you don't have the right tools in place and you don't have the right channels with communication open, it's challenging."
How Controllers and CFOs Use Cash Flow Analysis in Practice
Cash flow analysis feeds into nearly every strategic conversation a finance organization has. The core use cases include:
- Liquidity management: Ensuring the business can meet obligations.
- Covenant compliance Demonstrating to lenders that coverage ratios hold.
- Funding decisions: Timing debt draws or equity raises
- Working capital optimization: Tightening DSO, negotiating DPO
- M&A readiness: Demonstrating to acquirers or targets that cash generation is sustainable and the business can absorb deal costs or integration spend.
In practice, this means your cash flow analysis shows up in board decks as a waterfall chart explaining the quarter's cash bridge.
It appears in lender packages as trailing 12-month operating cash flow divided by debt service. It drives the FP&A team's scenario models when the CEO asks whether the company can afford to hire more engineers in Q3.
Consistency and auditability are what make these outputs trustworthy. If the CFO cannot trace a number in the board deck back to a reconciled bank balance and a tied-out GL, the analysis loses credibility. And once executives stop trusting the cash view, they stop making decisions from it.
Core Components of Cash Flow Statements and What "Good" Looks Like
Operating Cash Flow: The Quality of Earnings Lens
Operating cash flow starts with net income and adjusts for non-cash charges and changes in working capital. The key drivers to watch are AR collections, AP timing, inventory levels, prepaids, and accrued expenses.
The operating cash flow ratio — operating cash flow divided by current liabilities — tells you whether the business generates enough cash from operations to cover near-term obligations. A ratio consistently above 1.0 suggests healthy liquidity. Below 1.0, and you are funding operations through borrowing, asset sales, or burning reserves.
Red flags include consistently negative operating cash flow, DSO trending upward quarter over quarter, or operating cash flow that only looks positive because the company is stretching payables. That last scenario is common and dangerous: it inflates short-term cash at the expense of supplier relationships and supply chain reliability.
Investing Cash Flow: Growth, Capex, and Acquisitions
Investing cash flows cover capital expenditures, acquisitions, disposals, and investment securities. Large negative investing cash flows are not inherently alarming — a growth-stage company investing heavily in infrastructure or making strategic acquisitions should show significant cash outflows here.
The context matters. A $12 million CapEx line for a company expanding manufacturing capacity tells a different story than the same number for a company replacing aging equipment to stay operational.
When presenting investing cash flows to executives, connect the numbers to strategic outcomes: "This $8 million acquisition added 2,000 enterprise accounts to our pipeline" is more useful than "investing activities used $8 million."
Financing Cash Flow: Capital Structure in Motion
Financing cash flows include new debt issuances, debt repayments, revolver draws, equity raises, share buybacks, and dividend payments. Patterns here reveal funding strategy. Heavy reliance on revolver draws to fund operating cash shortfalls is a very different signal than a planned term loan to finance an acquisition.
Financing decisions do not exist in isolation. A company drawing on its revolver to cover a temporary working capital gap caused by a large customer paying 90 days late is making a financing decision driven by an operating cash flow problem. Understanding these interactions is what separates useful cash flow analysis from a mechanical exercise.
Step-by-Step Cash Flow Analysis Process for Controllers
Step 1: Collect and Validate Source Data
Start with your GL trial balance, prior and current-period balance sheets and P&L, bank statements, AP/AR aging reports, payroll and tax reports, and capex schedules. This is table stakes, but the sequence matters: reconcile bank accounts and key subledgers first. If cash reconciliations are incomplete, every downstream number is suspect.
This step is where most teams lose time.
Downloading statements from multiple bank portals, matching transactions manually, and tracking unreconciled items in spreadsheets introduces errors and delays that cascade into the rest of the process.
Numeric’s cash reconciliation and transaction reconciliation capabilities automate matching and surface discrepancies in real time, which compresses this step from days to hours for teams with high transaction volumes. That time savings compounds when you consider that reconciliation accuracy directly determines the reliability of everything built on top of it.
Step 2: Build or Update the Statement of Cash Flows
Derive operating, investing, and financing cash flows from balance sheet changes and the P&L using the indirect method. The check is simple and non-negotiable: the net change in cash must equal the difference between beginning and ending cash balances on your balance sheet.
Create a standardized mapping template from GL accounts to cash flow categories. This reduces the manual manipulation that introduces errors in spreadsheets and makes the process repeatable across periods. Document every assumption and reclassification. If you moved an item from operating to investing, record why — your auditors will ask.
Step 3: Analyze Trends, Drivers, and Variances
Compare current period cash flows to prior periods and to budget or forecast. Month-over-month, quarter-over-quarter, and year-over-year views each reveal different patterns. A single quarter of negative operating cash flow might reflect seasonal timing. Three consecutive quarters suggest a structural problem.
Focus on working capital drivers: DSO, DPO, inventory days, and accrued expenses. If DSO jumped from 42 to 58 days, it is a direct hit to operating cash flow that may require a financing response. Prepare a short narrative that explains the two or three largest variances in language a non-accountant can understand.
Step 4: Link Insights to Actions
This is where cash flow analysis creates value beyond compliance. Translate findings into specific recommendations: tighten credit terms for customers with rising payment cycles, renegotiate vendor payment terms to preserve cash, defer discretionary capex by one quarter to maintain covenant headroom, or plan a revolver draw to bridge a seasonal trough.
Flag early warning signs with proposed mitigation plans. A negative operating cash flow trend is a conversation starter about pricing, collections, or cost structure.
Heeger notes that when FP&A and accounting are not "in cahoots" and "the left hand is talking to the right hand," cash surprises follow. Establishing a recurring cash review cadence with the CFO and FP&A ensures insights translate into decisions.
Key Cash Flow Metrics, Ratios, and Dashboards
Core Liquidity and Cash Health Metrics
The metrics that matter most for ongoing cash health are the:
- Operating cash flow ratio (operating cash flow ÷ current liabilities).
- Days cash on hand (cash ÷ daily operating expenses).
- Cash runway — For venture-backed companies — (cash ÷ monthly net burn).
Lenders and boards reference these frequently, so producing them consistently builds credibility.
Monitor most metrics monthly during the close. In volatile periods — fundraising, M&A, covenant pressure — shift days cash on hand and runway to weekly reporting. Your cash position should never be a mystery when the CFO calls.
Working Capital and Cash Conversion Cycle
DSO (accounts receivable ÷ revenue × days in period), DPO (accounts payable ÷ COGS × days in period), and DIO (inventory ÷ COGS × days in period) roll up into the cash conversion cycle (DSO + DIO − DPO). A shorter cycle means cash is tied up in operations for less time.
The levers here are operational: invoicing discipline and proactive collections improve DSO, vendor payment term negotiations adjust DPO, and demand forecasting tightens DIO. Visualize these as trend lines by entity or business line to spot divergence early.
Free Cash Flow and Free Cash Flow Margin
Free cash flow (operating cash flow minus capital expenditures) and free cash flow margin (FCF ÷ revenue) measure the company's ability to self-fund growth, service debt, and return capital.
For growth-stage companies, negative FCF is often expected — but the trajectory matters. Improving FCF margin quarter over quarter signals progress toward sustainability even if the absolute number is still negative.
Compare free cash flow against peers and internal targets, but provide context. A company investing 25% of revenue in R&D capex should look different from a mature business spending 5%.
Common Reasons Cash Flow Analysis Is Unreliable or Late
Manual, Fragmented Bank Reconciliations and Cash Matching
Many teams still download bank statements, manually match transactions, and track exceptions in spreadsheets. When you are processing thousands of transactions across multiple accounts, timing differences, partial matches, and simple data entry errors accumulate. The result is that cash flow reporting waits on reconciliation — often the single biggest source of friction that Numeric's cash reconciliation automation is designed to solve. When reconciliation is late, everything is late.
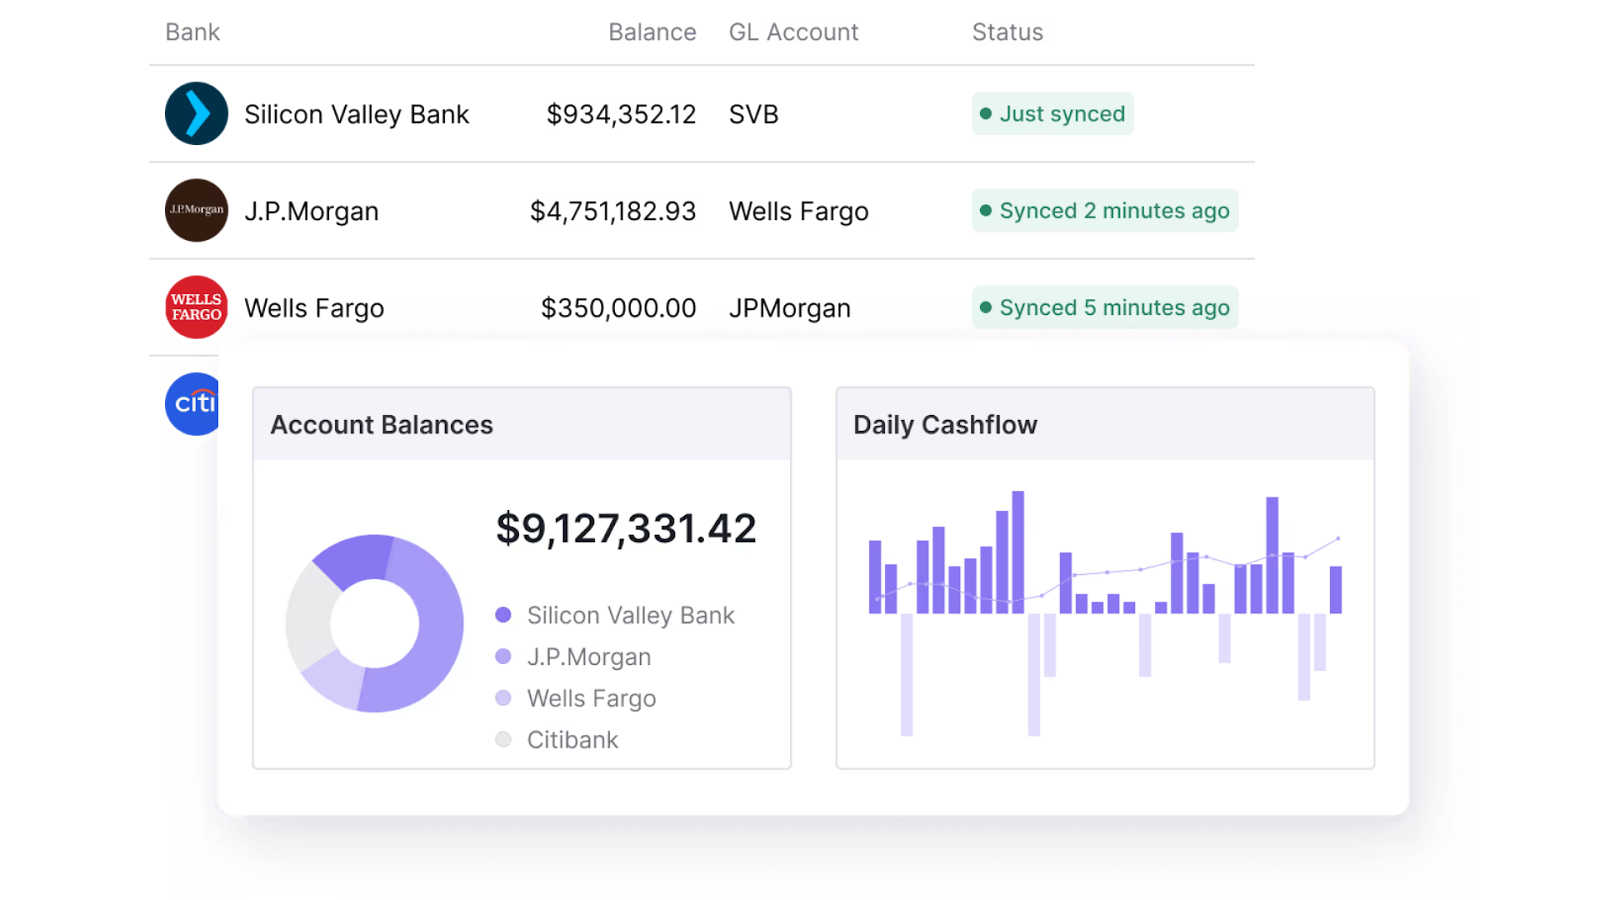
Scattered Bank Accounts, Entities, and Currencies
A company with 12 entities across three currencies and eight banking relationships faces a consolidation problem before any analysis can begin.
Logging into multiple bank portals, exporting CSVs, converting currencies at the correct rates, and manually consolidating balances takes time and introduces error. The risk is that executives make decisions based on a cash snapshot that was already stale when it was assembled.
Spreadsheet-heavy Cash Flow Models With Weak Controls
Complex spreadsheet models for both the Statement of Cash Flows and forecasting accumulate hidden logic errors, broken links, and version control problems over time.
As Heeger observes, the result is a team that is "always just playing catch up" — "constantly in close mode" without the headspace to improve systems or understand changes in the business. Automation should centralize logic and reduce manual manipulation, not just accelerate a broken spreadsheet workflow.
Best Practices for Building Reliable, Controller-Grade Cash Flow Analysis
Standardize Data Structures, Mappings, and Policies
Standardize your chart of accounts, entity codes, and naming conventions so that mapping to cash flow categories is mechanical rather than interpretive. Create a documented mapping from GL accounts to Statement of Cash Flows line items with clear ownership and change control. When AP, AR, Treasury, and FP&A all use the same structure, rework and reconciliation cycles shrink.
Establish Cadence, Ownership, and Review Rituals
Set explicit cadences — weekly cash huddles for cash management, monthly deep dives during the close — and assign clear owners for producing and reviewing cash flow analyses.
Define review checklists: reconcile to bank balances, validate large or unusual items, obtain Controller or CFO sign-off. Document issues discovered during review and close the loop with process improvements so the same problem does not recur.
Heeger’s advice applies here directly:
"You've got to go and list out all those different steps to be in a position where you're not sort of fumbling around at 11 at night trying to make sure you've dotted all your I's and crossed all your T's."
Communicate Cash Insights Clearly to Non-Financial Stakeholders
Replace dense tables with simple waterfall charts, runway visualizations, and traffic-light risk flags. Summarize in plain language: here is where cash came from, where it went, what changed versus last period, and what we recommend. Partner with FP&A to craft board and leadership narratives that connect cash to strategy, not just reporting.
How Numeric Removes Friction From Cash Flow Analysis
The upstream work — reconciling bank accounts, matching transactions, posting journal entries — is where cash flow analysis breaks down in practice.
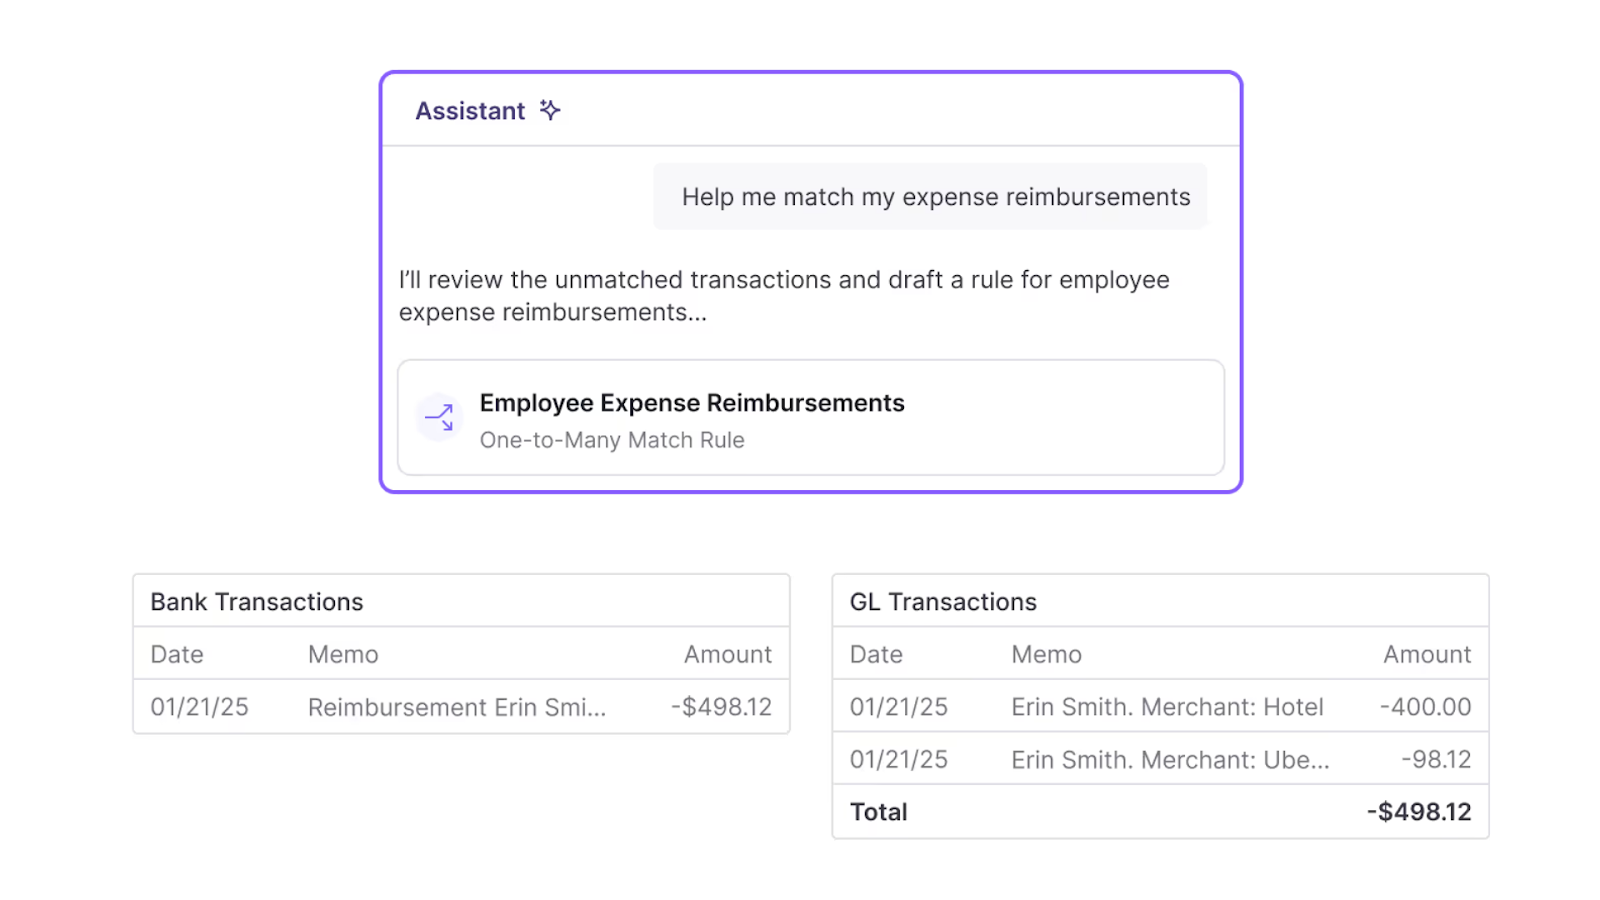
Numeric’s cash management product automates cash matching with a rules engine that handles one-to-one through many-to-many matching scenarios, connects to 12,000+ banks for real-time balance visibility, and drafts and posts journal entries to NetSuite in batch.
Combined with close management and analytics in a single platform, this turns cash flow analysis from an end-of-month scramble into a continuous process built on data you can trust.
Level Up With Accurate, On-Time Cash Flow Analysis
Cash flow analysis is a Controller's superpower when it is built on clean reconciliations, standardized mappings, meaningful metrics, rolling forecasts, and clear communication.
Teams that modernize these processes — replacing fragmented spreadsheets with repeatable, automated workflows — gain faster insight and credibility that compounds with every close cycle.
The building blocks are straightforward. The discipline to maintain them is what separates cash flow analysis that drives decisions from analysis that just fills a reporting obligation.
Sign up to our newsletter to get fresh accounting tips and news about AI.
Frequently Asked Questions

Related Content

The Finance Engineer: Why Accountants Are the Best Builders in the Room
Why accountants, not engineers, are becoming the best builders on modern finance teams. Meet the Finance Engineer.
.png)
Numeric vs. Ledge: What's the Best Close Platform for Your Business?
A detailed comparison of Numeric and Ledge, two modern close management platforms, covering features, architecture, pricing, and a framework for choosing the right fit for your team.
.png)
What is Record to Report: Process, Steps, and Benefits
Learn how the Record to Report process works, from transaction capture to financial reporting. Discover steps, challenges, automation strategies, and best practices for modern accounting teams.